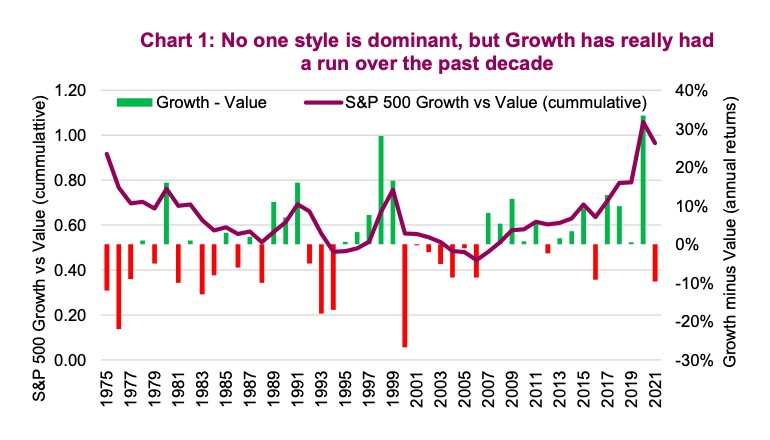
Perhaps one of the more pressing questions for asset allocators and portfolio managers is whether or not the recent resurgence in value stocks is a true turning point or just a blip in the continued dominance of growth. It’s rare to see one style dominate for so long like growth stocks have, with such a huge acceleration in the trend in 2020 (see the chart below).
Was 2020 a blow off top for Growth versus Value? Or has the market truly changed?
Growth fans will point out that valuations are not outrageous and are dominated by cash-rich technology companies, many of which enjoy monopolistic markets or significant network effects.
The S&P 500 Growth index is over 50% weighted to information technology. Value, on the other hand, is more tilted towards financials, health care, retail and energy.

Just because a trend has run for a decade doesn’t mean it has to end. For example, value enjoyed a similar dominant trend from the mid 1970s to the late 1980s. However, there are a number of factors that favour value over growth companies in 2021 and beyond.
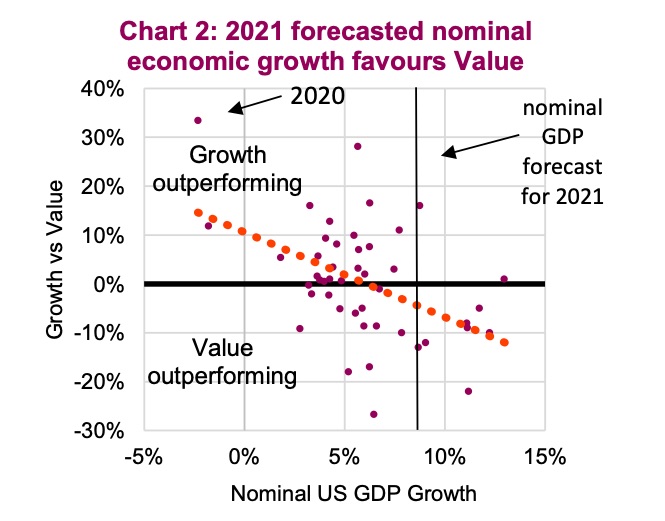
It may surprise readers that in the U.S., growth stocks tends to do better than value stocks during periods of slower economic growth. This is evident in the data (chart 2) although far from a perfect relationship.

The reason behind this loose relationship is value stocks tend to be more sensitive to the overall economy while growth stocks are less so. Better economic growth, helps value names more.
There is also a scarcity factor: when the economy is growing slowly or even shrinking, fewer companies tend to have positive earnings growth. This creates an environment where growth is scarce, which can lead to growth companies receiving a scarcity premium. The good news for value in 2021 is U.S. nominal GDP is expected to expand around 8%. This will help lift the earnings of many companies, and given value has more economically sensitive companies, it could easily outperform growth.
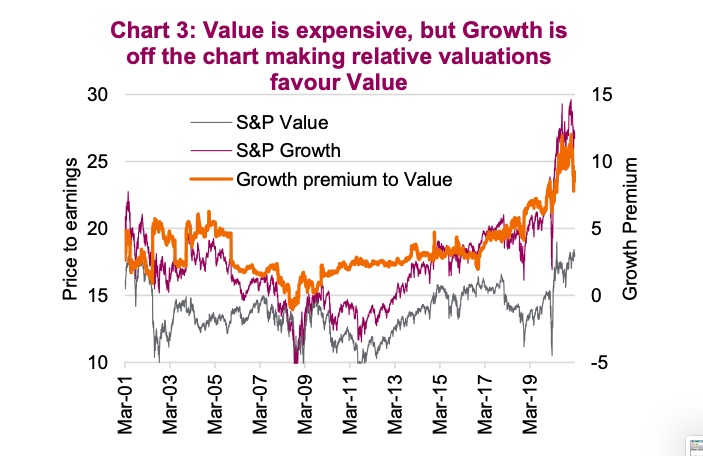
Then there are valuations. Here it get’s a little tricky: if you looked solely at the valuations in the S&P 500 Value index, you would say it is expensive. And it is, based on its history. Over the past 20 years, the value index has traded with an average price-to-earngings ratio of about 14x. This is based on forecasted earnings for the next 12 months. Today, the S&P 500 Value index is trading at a lofty 18x. But growth valuations are off the chart (chart 3 – not literally off the chart). Even with the recent relative underperformance of growth vs value, the spread is still high at 25 8.7x (Growth 26.8x, Value 18.1x).

Investment Implications
Portfolio construction is all about placing your bets on factors or exposures or positions you believe are set to perform better than others. But there are no certainties. Could U.S. growth continue to outperform? Absolutely, but we believe the likelihood is greater that value will continue to win in the coming quarters if not years. While maintaining exposure to both we would continue to tilt more towards value over growth, especially in the U.S. equity market. This tilt towards value also favors many non-U.S. equity markets including Europea and Canada. We are more value than growth.
Source: Charts are sourced to Bloomberg L.P. and Richardson Wealth unless otherwise noted.
Twitter: @ConnectedWealth
Any opinions expressed herein are solely those of the authors, and do not in any way represent the views or opinions of any other person or entity.


