This seems to be the hot topic.
Even with a constant negative news stream, the U.S. stock market indices just refuse to decline with any intent.
Rather than overthinking it, it’s best for investors to follow the price action (i.e. trends).
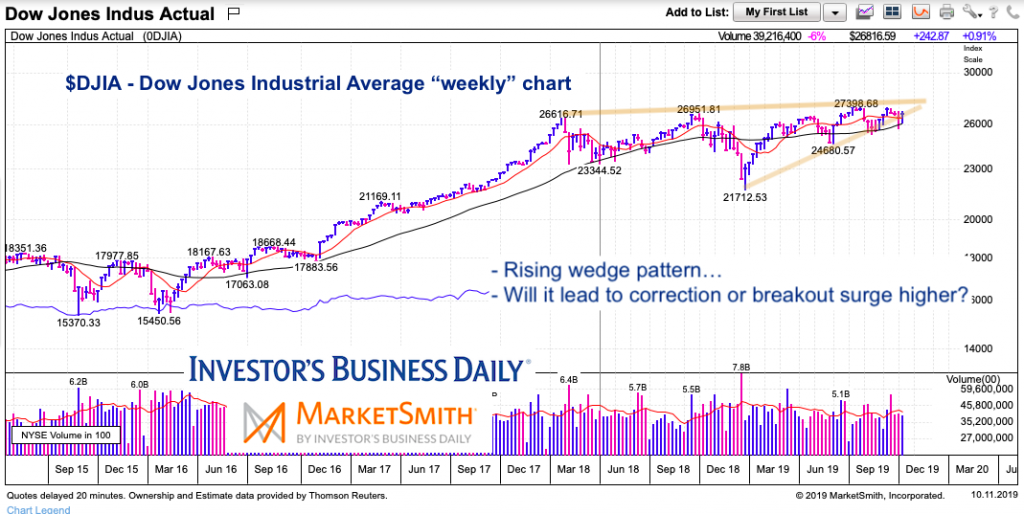
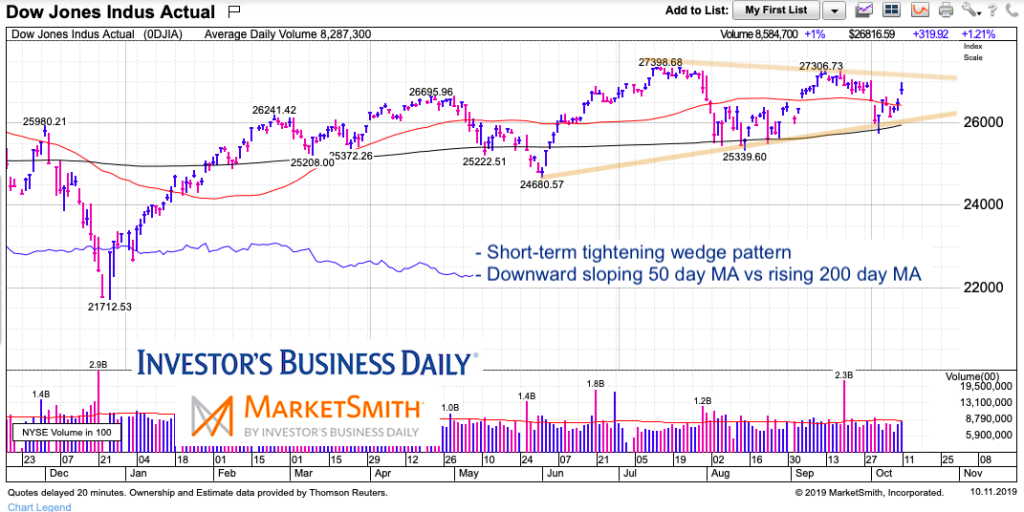
Within that context, we can look at the major stock market averages and see how they are respecting their bull market trends… and further, if they are breaking out. Today’s chart looks once again at the Dow Jones Industrial Average. As I have mentioned in the past, this index is broadly followed by global investors. Below are “weekly” and “daily” charts.
Note that the following MarketSmith charts are built with Investors Business Daily’s product suite.
I am an Investors Business Daily (IBD) partner and promote the use of their products. The entire platform offers a good mix of technical and fundamental data and education.
Dow Jones Industrial Average “weekly” Chart
Here we see the index on a broader timeframe. We can see that the stock market has been consolidating in a rising wedge formation. While these tend to be bearish, this has a very slightly rising top resistance line.
A breakout or breakdown should be on investors’ radars.

Dow Jones Industrial Average “daily” Chart
The daily chart is for traders. Should the Dow Industrials breakout above this triangle/wedge pattern, then we would expect it to test the upper end of the rising wedge pattern on the “weekly” chart above (around 28000).
Timeframes matter. Watch resistance here on the “daily”… if we get a breakout, then watch resistance on the “weekly”. Good luck out there!

Twitter: @andrewnyquist
The author may have a position in mentioned securities at the time of publication. Any opinions expressed herein are solely those of the author, and do not in any way represent the views or opinions of any other person or entity.


