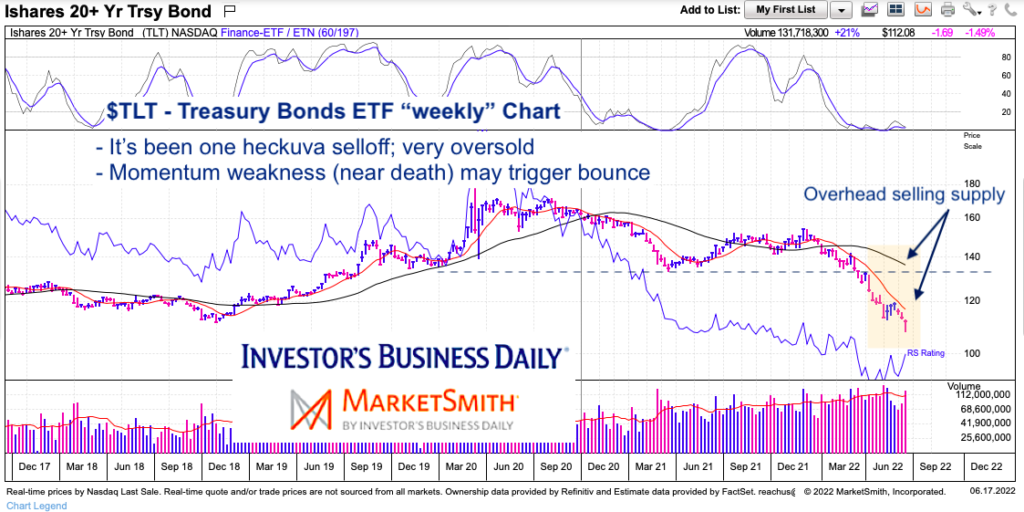
The bond market selloff over the past 2 years isn’t getting enough attention.
It’s the other side of the equation making headlines: Interest rates & bond yields
Let me explain. Obviously the two are related. But everyone is talking about interest rates, real estate, and the slowing economy. Fair enough. But what about all the retirement portfolios that are invested in treasury bonds? They are down. A lot. Just like stocks. So much for a conservative investment.
We highlight this decline today via the $TLT (20+ Year Treasury Bond ETF). But, as we highlighted earlier this month, interest rates may pause/pullback (inverse relationship) and this may trigger a rally in treasury bonds.
Note that the following MarketSmith charts are built with Investors Business Daily’s product suite.
I am an Investors Business Daily (IBD) partner and promote the use of their products. The entire platform offers a good mix of analysts, education, and technical and fundamental data.
20+ Year Treasury Bonds ETF “weekly” Chart
As the 10-Year treasury bond yield meets resistance around 3.3%, this bonds chart ($TLT) is getting very oversold. This is NOT a reason to buy. Sometimes dislocations can occur on very oversold chart. BUT it is a time to be aware that a bounce is becoming more likely.
That said, should the bounce unfold, we need to be aware of overhead supply (selling areas). One is the most recent high (also near the 10-week falling moving average). Should a more significant bounce develop, then we would want to watch the $133-$135 area that marked old price support (now resistance) as well as the falling 40-week moving average.

Twitter: @andrewnyquist
The author may have a position in mentioned securities at the time of publication. Any opinions expressed herein are solely those of the author, and do not in any way represent the views or opinions of any other person or entity.


