The financial markets are panicking and its producing some huge swings across asset classes.
One asset that may be producing a monster reversal is treasury bonds (TLT).
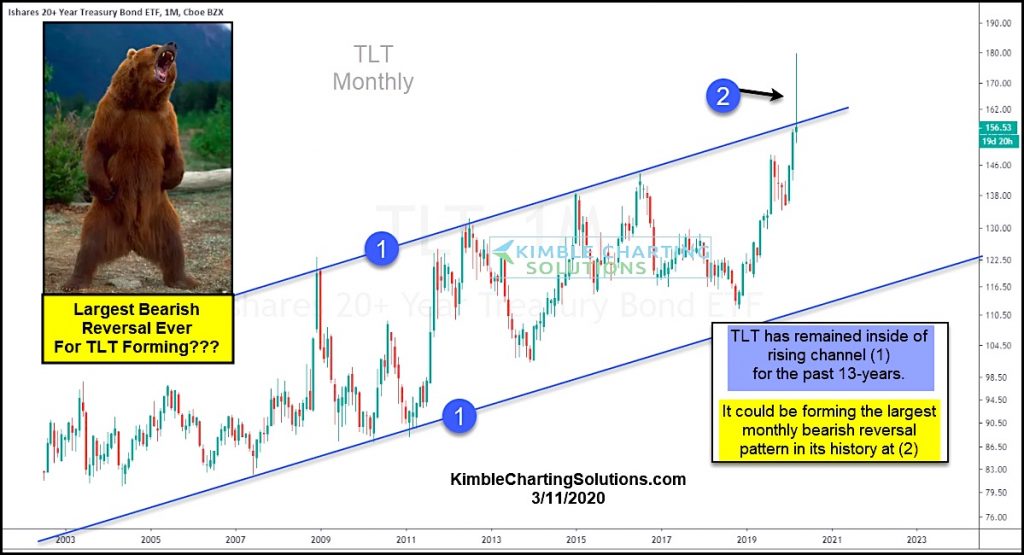
The flight to safe havens produced a sharp rise in the 20+ Year US Treasury Bond ETF (TLT). But that thrust higher was met with heavy selling the first 3 days of this week.
You can see this in the first chart below – a “monthly” chart the $TLT.
Thus far, the “monthly” candlestick has produced a monster bearish reversal wick. We have a ways to go until month end, but if this reversal holds, it could be the largest ever.
And that would be very bearish for bonds on a “longer term” time frame.
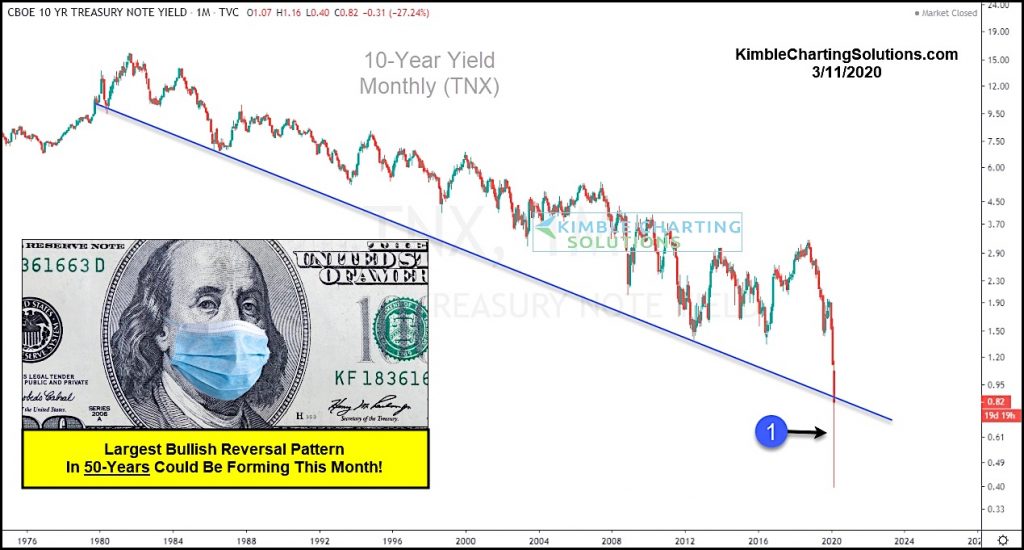
The second chart shows the same reversal for yields, but its a bullish reversal. Wow… Stay tuned!
$TLT 20+ Year US Treasury Bond ETF “monthly” Chart

$TNX 10 Year US Treasury Bond Yield Chart

Note that KimbleCharting is offering a 2 week Free trial to See It Market readers. Just send me an email to services@kimblechartingsolutions.com for details to get set up.
Twitter: @KimbleCharting
Any opinions expressed herein are solely those of the author, and do not in any way represent the views or opinions of any other person or entity.


