Tech stocks have been leaders once again in 2023 following its broad-based correction into 2022.
BUT, we are not out of the woods just yet!
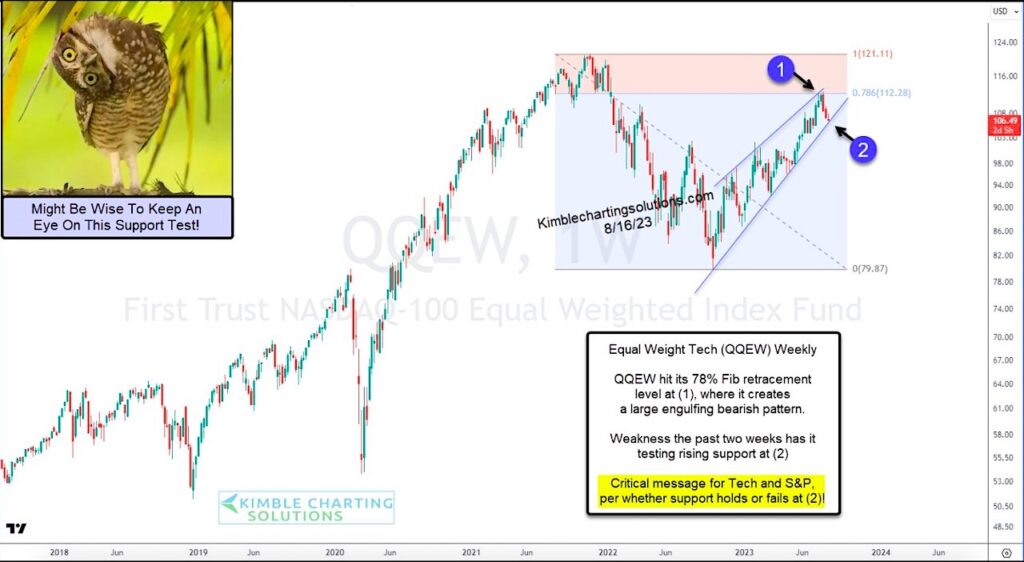
Today’s chart looks at the Equal Weight Nasdaq 100 ETF (QQEW) and provides an insightful snapshot of the current state of large cap technology stocks.
As you can see, the rally reached all the way up to the 78% Fibonacci retracement level at (1) before pulling back this month. And the rally has taken the shape of a narrowing rising wedge.
Currently, QQEW is testing its rising support trend line at (2). This looks very important over the near-term.
In my humble opinion, what happens here will send a critical message to the broader stock market. Will support hold or fail? Stay tuned!
$QQEW Equal Weight Nasdaq 100 ETF “weekly” Chart

Note that KimbleCharting is offering a 2 week Free trial to See It Market readers. Just send me an email to services@kimblechartingsolutions.com for details to get set up.
Twitter: @KimbleCharting
Any opinions expressed herein are solely those of the author, and do not in any way represent the views or opinions of any other person or entity.


