The S&P 500 Index (INDEXSP:.INX) and financial markets are trying to climb a wall of worry this week. While sentiment indicators flash red, real-time data on consumer spending, labor markets, and credit conditions suggest a much more stable macro environment.
As recent as yesterday, the CEO of Bank of America mentioned how their customers are spending 6% more than a year age. The disconnect between survey data and hard data is notable-investors remain fearful, yet economic activity shows resilience.
We’ve been highlighting this for weeks: fear is overblown and positioning remains historically defensive. Rebalancing and allocating makes sense in our view.
Summary of economic and investing data points:
- Real estate contributes in 2025?
- Consumer and business spending remains resilient.
- Financial conditions remain loose. Capital markets are open, and liquidity is available. For now?
- Freight rates are falling. Tariff offset?
- Tax refunds are ahead of 2024.
- Market breadth is improving. We’re seeing bullish technical confirmation, suggesting stocks grind higher
So, let’s break it down. We start with real-time consumer trends, then move into market signals, before closing with investment implications.
Real Estate Has Been Missing From GDP Last Couple Years…
So I wanted to start with housing cause I think we’re at an interesting point. Where the path of least resistance for rates in our opinion is likely lower. Real time inflation is tracking at 1.7%, so it’s hard to make the case that we’re seeing any sort of inflationary impulses. That leaves the economic picture as the leading driver for rates, and if the economy moderates, we should therefore expect rates to moderate rate as well.
Housing has been stuck in mud over the last two years, following the rise in rates. Therefore, any continued moderation in rates would likely be stimulative to one of the largest segments of the economy. So let’s lead with that.
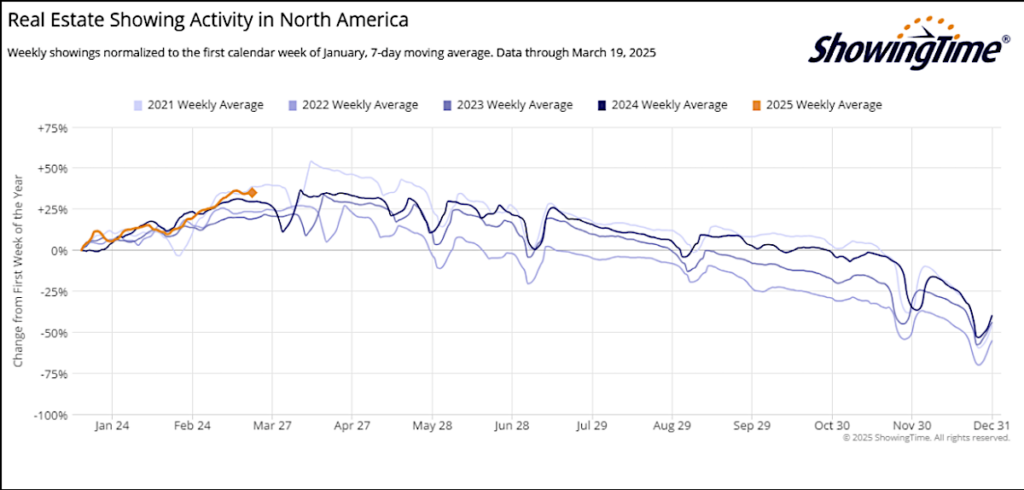
The data below shows demand for housing.
Home showings from Zillow’s owned ShowingTime, a leading indicator of housing demand, is tracking at 2021 levels, well above 2024. This suggests that despite higher mortgage rates, buyer demand remains intact. Historically, home touring activity precedes actual home purchases, making this a strong forward-looking indicator. The fact that 2025 is following 2021 trends instead of the weaker 2022-2024 period indicates resilience in the housing market.
Credit Card & Small Business Spending Remains Firm…
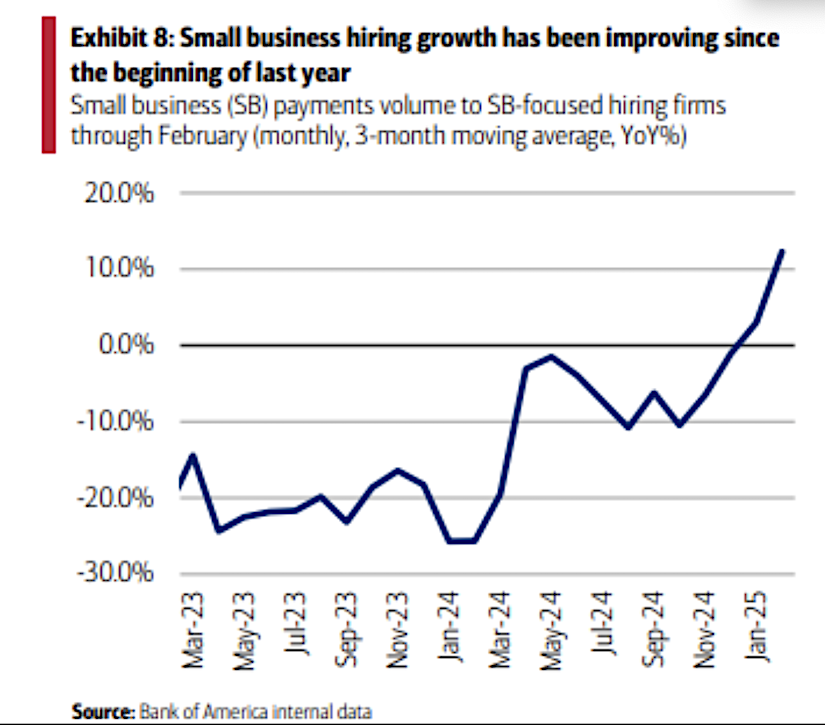
We showed some of this last time, but here is an updated view. Bank of America’s small business hiring data shows continued strength, with businesses expanding their workforce. Not what I hear in the media.
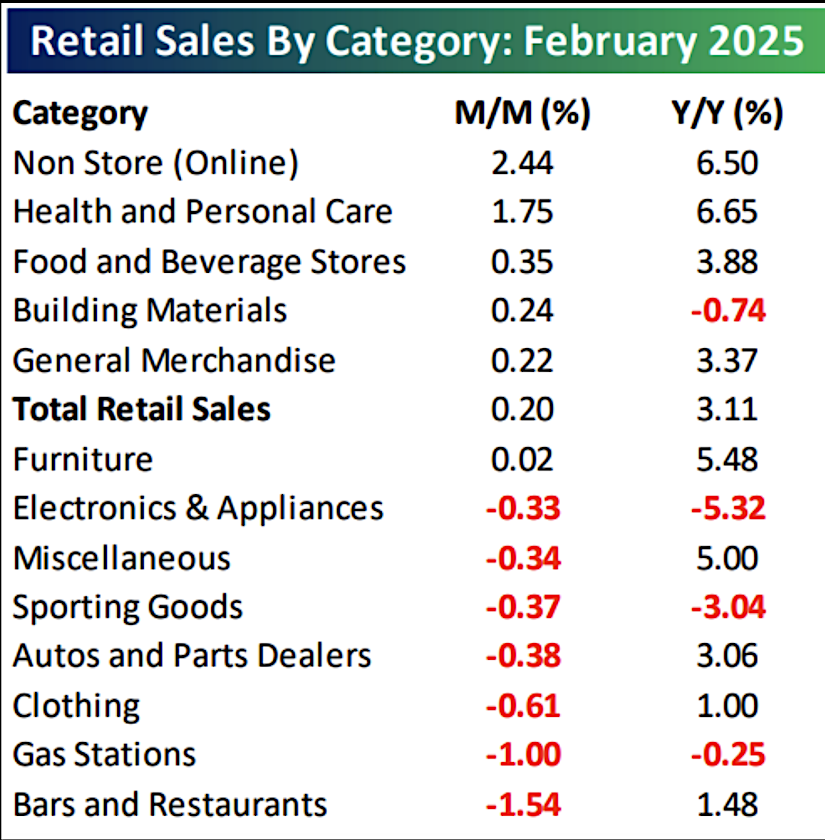
Meanwhile, consumer spending dipped in February but rebounded as weather-related disruptions eased. February retail sales showed weakness in restaurants, clothing, and gas stations, largely attributed to weather disruptions and the leap year effect. However, e-commerce, health products, and general merchandise saw solid year-over-year growth, indicating that underlying demand remains firm. This suggests that the recent dip in retail activity is likely temporary rather than a sign of broad consumer weakness. More on the next chart.
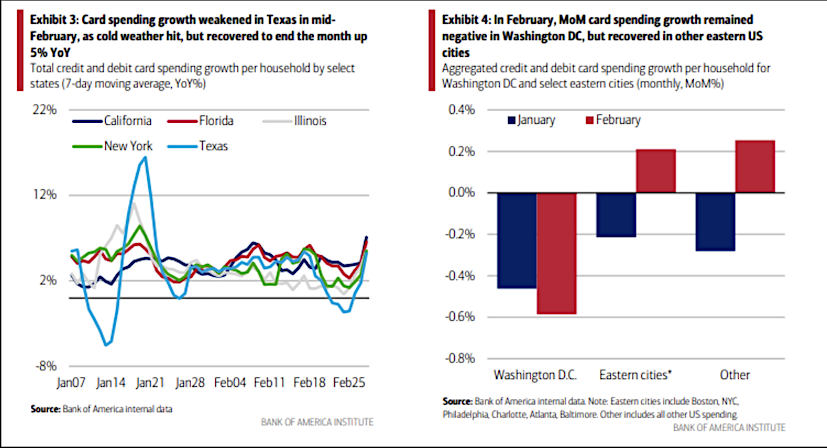
Spending picked up in March according to the data. Notably, the Bank of America CEO stated that consumer spending is up 6% Y/Y, reinforcing the idea that demand remains firm. Despite survey concerns, consumers continue to spend, providing a steady economic backbone.
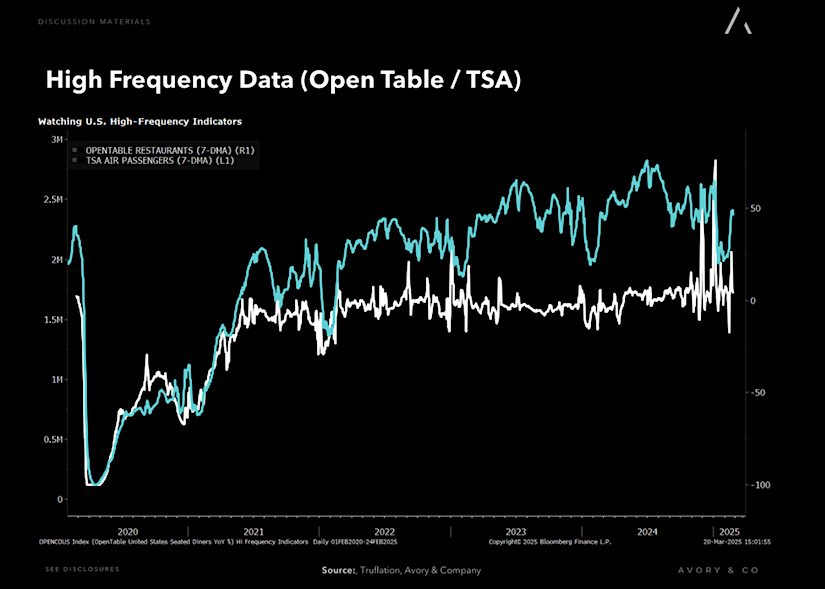
High-Frequency Data: Also Saying No Signs of Consumer Weakness
TSA Passenger Data and OpenTable reservations remain steady, indicating no meaningful slowdown in travel or dining activity. This suggests that discretionary spending is still resilient.
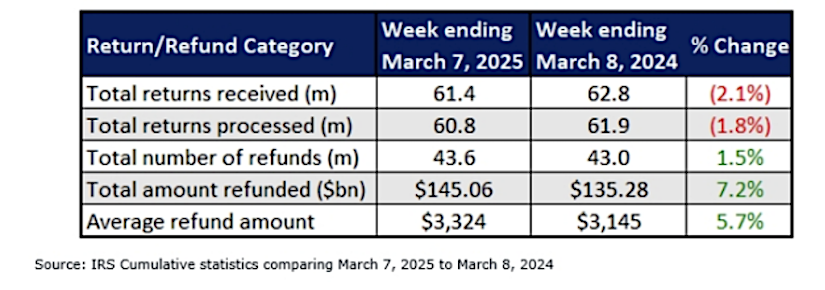
Additionally, tax refunds are adding liquidity into the economy, with the average refund amount up 6% Y/Y and total refunds disbursed up 7.2% Y/Y. This seasonal boost to household cash flow should support consumer spending in the near term.
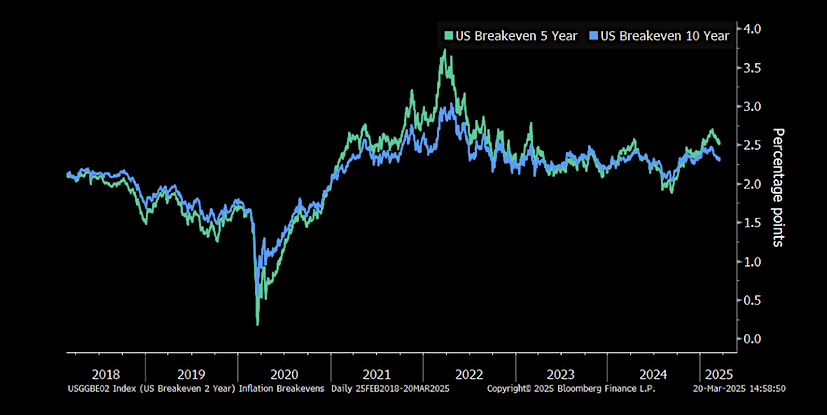
Inflation Expectations Are Well-Anchored
Market-based inflation expectations, as measured by 5-year and 10-year breakevens, remain within the 2.2%-2.5% range, showing no signs of an inflation spiral. Yes 2 year breakevens have moved higher on tariff fears, but not longer term readings.
Meanwhile, real-time inflation data suggests price growth is hovering around 1.7%, well below the Fed’s target. This stability aligns with Jerome Powell’s recent comments indicating that inflation expectations remain anchored. While counter to many, we think Powell feels comfortable on inflation.
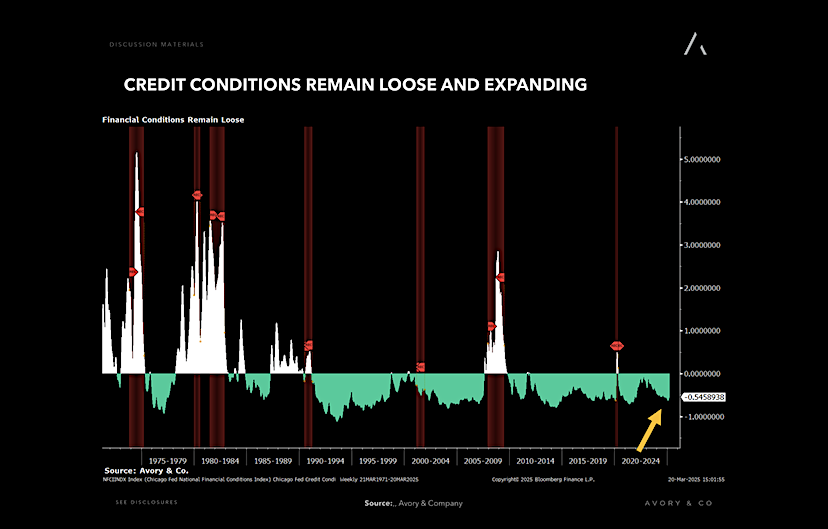
Financial Conditions Remain Loose
Now onto some of the indicators we look at to see how healthy financial conditions are.
Credit conditions remain supportive of economic growth. We are seeing large transaction activity—such as Google’s $32B Wiz acquisition, Klarna’s IPO prep, and CoreWeave’s $23B IPO—suggest that capital markets remain open and liquid. This indicates that businesses still have access to funding, reducing the risk of an economic slowdown driven by financial tightening.
Also ask yourself would Google be making its largest acquisition ever if they saw meaningful weakness across its platforms???
Another datapoint is the aggregate financial conditions index. Which shows loose conditions.
Add in that the Fed essentially went from QT to lesser QT. This should be support on the margin for rates.
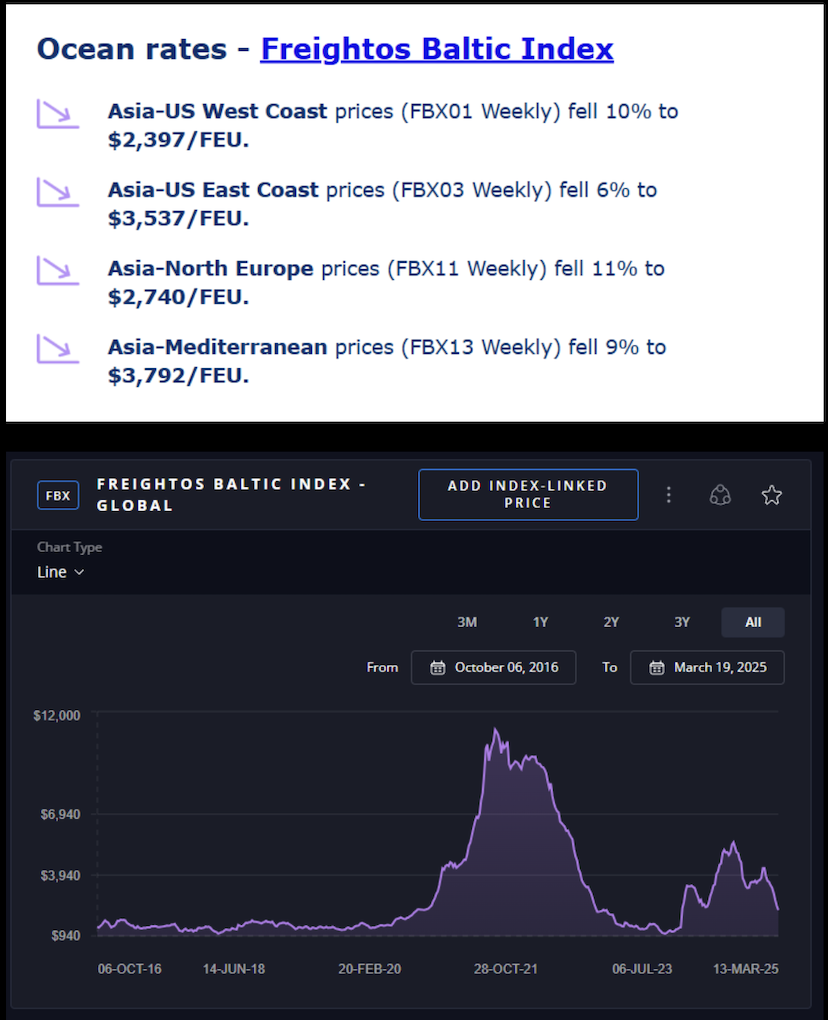
Freight Costs Plummet, Easing Supply Chains = Counter to Tariffs
Global shipping costs continue to decline, with ocean freight rates down 6%-11% week-over-week. Lower freight costs increase profit margins for businesses and lower prices for consumers, which can further boost spending power. All of that is the opposite of what tariffs do.
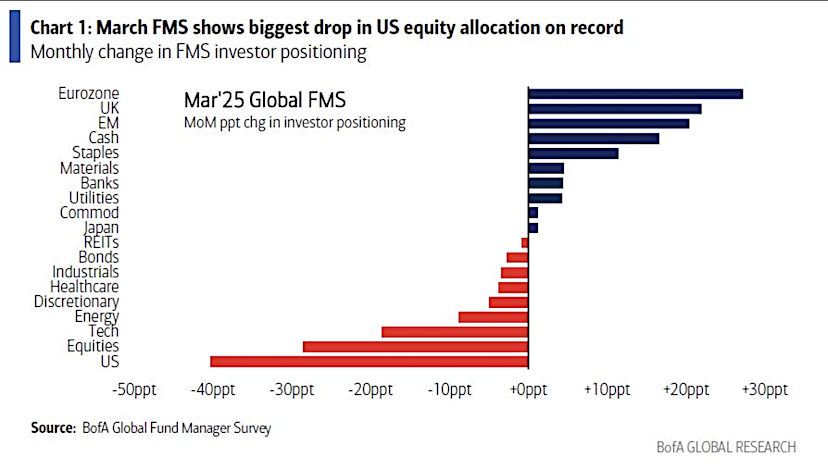
Record Fund Manager Bearishness
Now let’s turn to the markets.
The March Fund Manager Survey revealed the biggest drop in US equity allocations on record, reflecting extreme investor pessimism. Historically, when positioning reaches such negative extremes, it tends to mark a turning point for equities, as markets are often forward-looking.
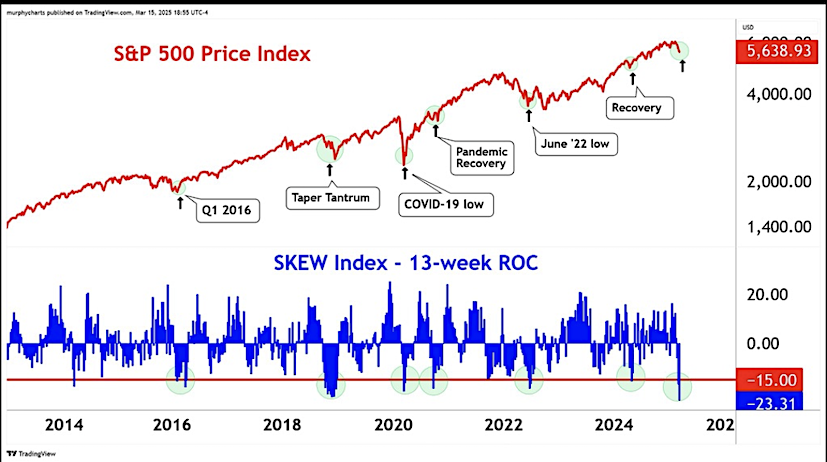
More bottoming indicators.
The SKEW Index, which measures market hedging against tail risk, has dropped to levels associated with market bottoms (chart below courtesy of MurphyCharts on TradingView). This suggests that investors are overpaying for protection, a signal that often precedes a short-term market rally.
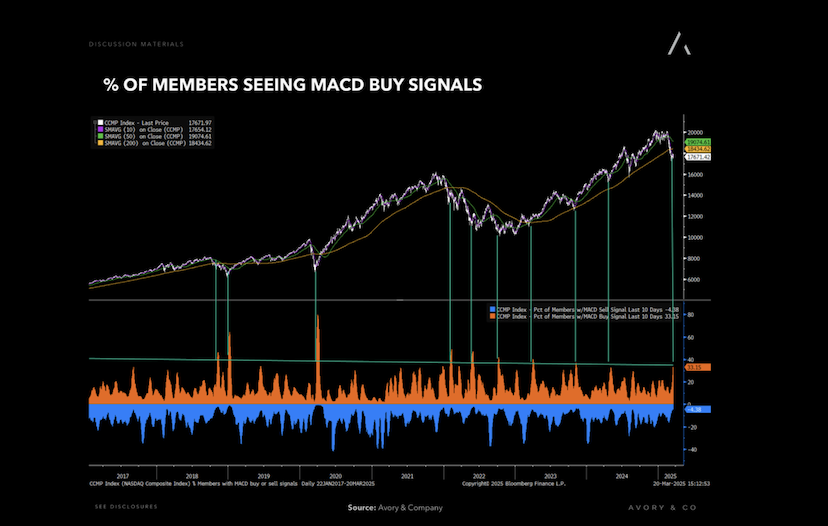
Breadth Thrusts / MACD Buy Signals Confirm Bullish Momentum Change?
The percentage of stocks triggering MACD buy signals is at levels that historically indicate a near-term market bottom. Previous instances of similar breadth thrusts have resulted in strong forward equity returns, confirming that market internals are improving even as headlines remain cautious.
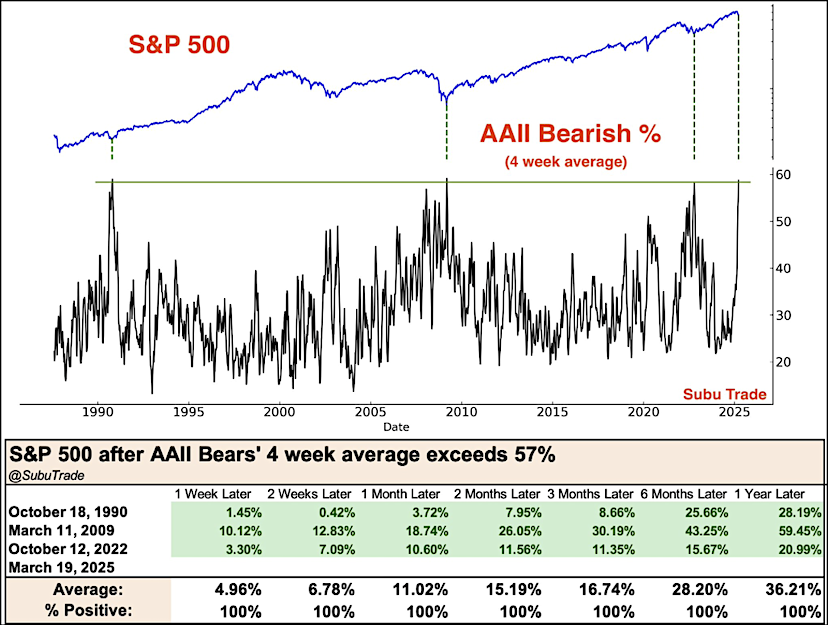
Add on that 4 weeks of bearishness with the AII Investor Sentiment reading hovering at 58%. This 4 week average is rare. It has only happened in the worst of times, however forward returns are very strong going forward with avg 12 month return +36%.
Takeaway:
The data continues to point toward stability, not some big economic collapse. While sentiment indicators scream fear, actual economic activity remains firm as per above. If we see something different, we will change our opinion. Especially if we believe that any of the information signals permanent loss of capital risk to any of our companies. Investors are underweight risk assets, credit conditions are supportive, and technical breadth signals are turning bullish. If history is any guide, this setup favors meaningfully higher markets in 6-12 months ahead.
Twitter: @_SeanDavid
The author and/or his firm have positions in the mentioned companies and underlying securities at the time of publication. Any opinions expressed herein are solely those of the author, and do not in any way represent the views or opinions of any other person or entity.


