Technology stocks have been a bona fide leader, repelling sell off attempts and pushing higher.
Same goes for the undisputed king of technology, the Semiconductors Sector (SMH).
BUT, we are at a critical crossroads for SMH (and the broader market!).
“The facts, Ma’am. Just the facts.” – Joe Friday
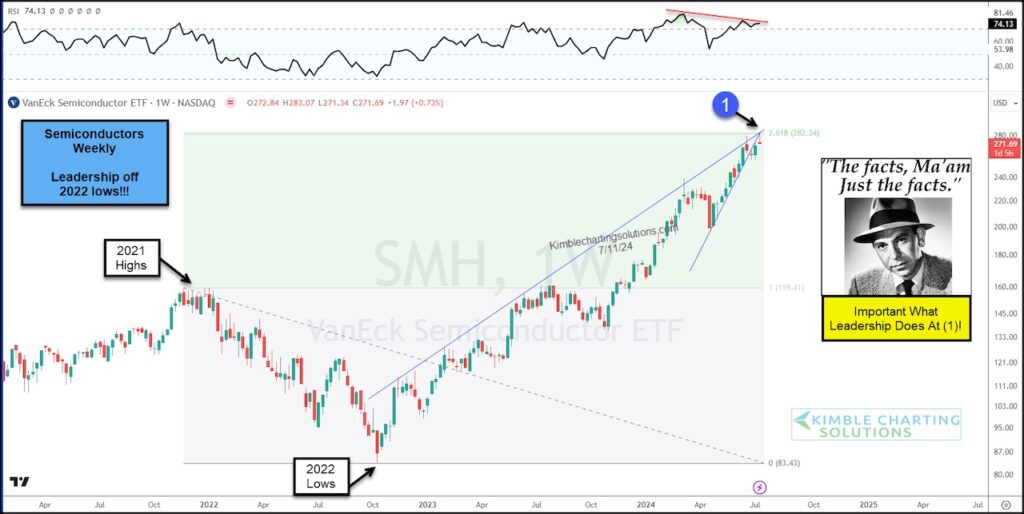
Today we look at a “weekly” chart of the Semiconductors Sector (SMH) to highlight some recent concerns.
As you can see, SMH appears to be in a rising wedge formation with a momentum divergence (rising prices but falling momentum).
Using applied Fibonacci to the 2021 highs and 2022 lows, we can also see that price has slowed near the 261.8 Fibonacci level at (1).
It will be important to see what leadership does at (1). SMH has spent the past month kissing the underside of this 261% Fibonacci level. Will this mark a near-term top? Or just a level for consolidation. Stay tuned!
$SMH Semiconductors ETF “weekly” Chart
Note that KimbleCharting is offering a 2 week Free trial to See It Market readers. Just send me an email to services@kimblechartingsolutions.com for details to get set up.
Twitter: @KimbleCharting
The author may have a position in mentioned securities. Any opinions expressed herein are solely those of the author, and do not in any way represent the views or opinions of any other person or entity.


