Rising interest rates are finally getting some attention here, and by all accounts, investors are concerned!
The rate with which treasury yields have moved higher has caught many off guard and may be part of the recent uptick in market volatility.
Will interest rates pull back now that the market is grumbling? How much is enough?
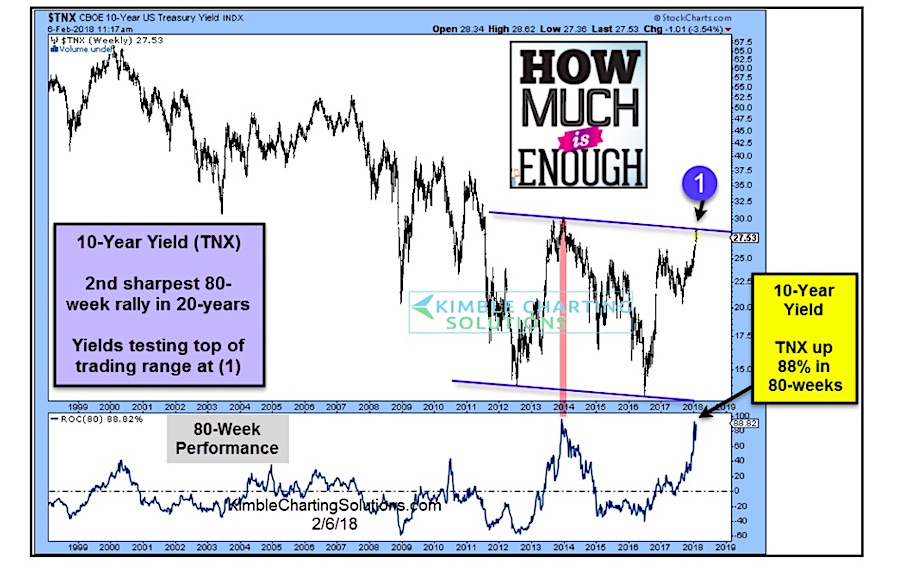
In the 2-pack of charts below, two things are apparent: 1) Rates have risen very quickly and 2) They are due for a breather. The latter would be music to investors ears, as it takes time for the markets to digest a change in trend (especially with interest rates).
Looking at the chart of 10-Year US Treasury Yield Index, you can see that treasury yields are testing the top of a 5 year trading range. This should provide some resistance for interest rates, especially when you consider that its the 2nd sharpest 80-week rally in 20 years!
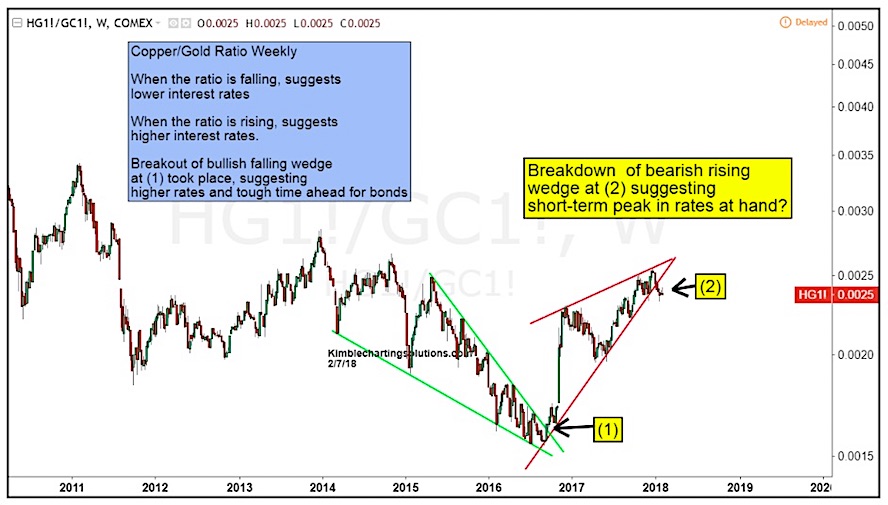
Another indicator seems to be saying the same thing here: The Copper/Gold Ratio. When this ratio is falling (copper underperforming gold), it suggests that lower interest rates. And when its rising, higher interest rates.
Currently, this ratio is breaking down and out of a bearish rising wedge pattern. This supports the notion that a short-term peak in interest rates may be at hand. Stay tuned!
Note that KimbleCharting is offering a 30 day Free trial to See It Market readers. Just send me an email to services@kimblechartingsolutions.com for details to get set up.
Twitter: @KimbleCharting
Any opinions expressed herein are solely those of the author, and do not in any way represent the views or opinions of any other person or entity.


