Investors can get a pretty good idea of the market’s risk appetite by looking at Junk Bonds (or in this case the High Yield ETF – JNK). Just think of Junk bonds this way: a risk investment and a yield play.
In a volatile world, institutional investors try to get out of them. So it’s probably a good idea to see how JNK is performing of late.
When analyzing junk bonds as a market gauge, I say keep it simple – a wide angle, macro perspective.
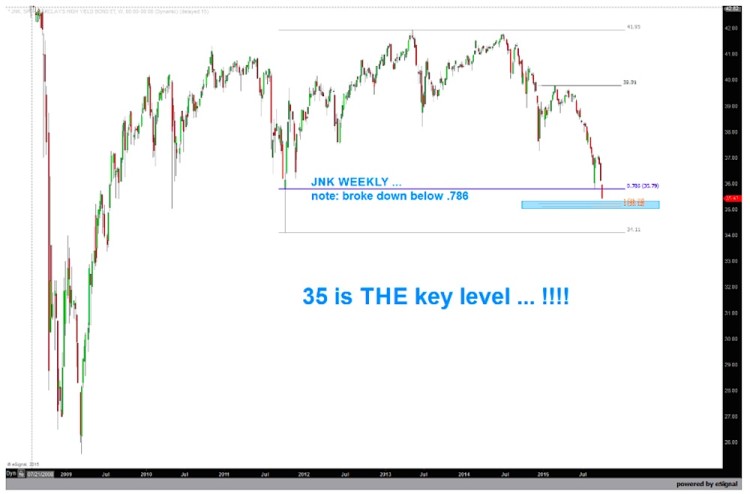
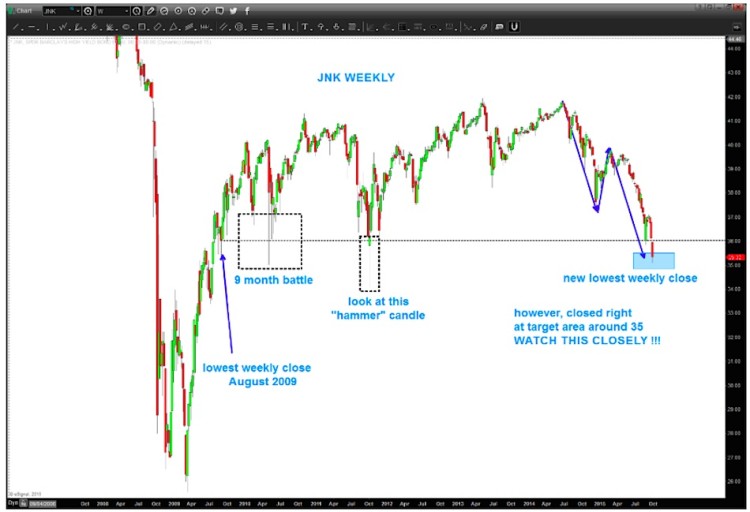
Taking a look at the chart below, we should note how junk bonds were crashing coming into the 2009 low. Then came a nice bounce and some sideways action into June 2014… when it started to crack. And the more recent price action has seen some heavy selling pressure with the first noticeable gap down occurring last week AND (this is important) the lowest weekly close since August 2009.
Note the dashed black boxes. Those were all attempts at trying to get below support but were defeated. What’s the positive spin? Well, as you can see in the chart below the 35 level was ID’d within a pattern and it has hit and held for now. Why for now? Well a gap down and some “selling candles” make it probable that we could lose this level to the downside. HOWEVER, if history is our guide, their has been a snap back rally since 2009 each time this level was defeated. So be on the lookout for strength! A small, dead count bounce isn’t good and will tell us if something isn’t right (if/when)…
Here is JNK as of Sunday night. Over the coming days, expecially Tuesday, monitor this pattern closely for a directional bias and a “risk on” vs “risk off” appetite (with regard to market volatility).
Thanks for reading.
Twitter: @BartsCharts
Author does not have a position in mentioned securities at the time of publication. Any opinions expressed herein are solely those of the author, and do not in any way represent the views or opinions of any other person or entity.


