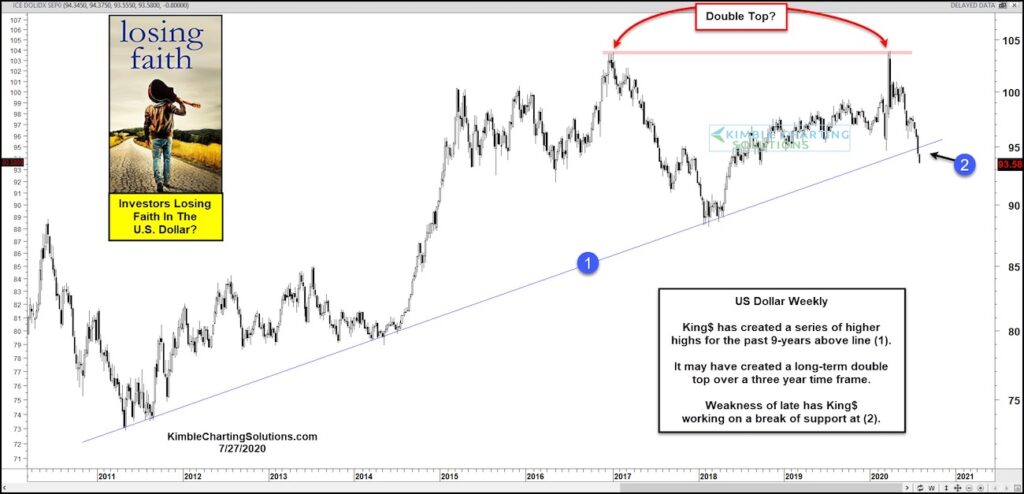
US Dollar Currency “Weekly” Chart
The US Dollar is the King of the currency markets. But recent trading patterns may be sending a warning sign to US Dollar bulls.
Today we look at a “weekly” chart of the US Dollar.
As you can see, King Dollar has made a series of higher highs while maintaining its up-trend line at (1) for the past 9-years.
Over the past 3 year, however, the Dollar may have created a bearish “double top” pattern. Since the second peak in 2020, the Dollar has fallen sharply and is attempting to break its 9-year trend support line at (2).
If King Dollar doesn’t reverse higher soon, it may be an indication that investors are losing faith in the US Dollar.
The decline has sent effected dollar-sensitive assets, notably sending precious metals prices higher. Stay tuned!
Note that KimbleCharting is offering a 2 week Free trial to See It Market readers. Just send me an email to services@kimblechartingsolutions.com for details to get set up.
Twitter: @KimbleCharting
Any opinions expressed herein are solely those of the author, and do not in any way represent the views or opinions of any other person or entity.


