There are a lot of indicators to follow when trying to project future stock market performance.
But today we look at an indicator that has a pretty strong record of signaling when stocks are near a top.
“The facts, Ma’am. Just the facts.” – Joe Friday
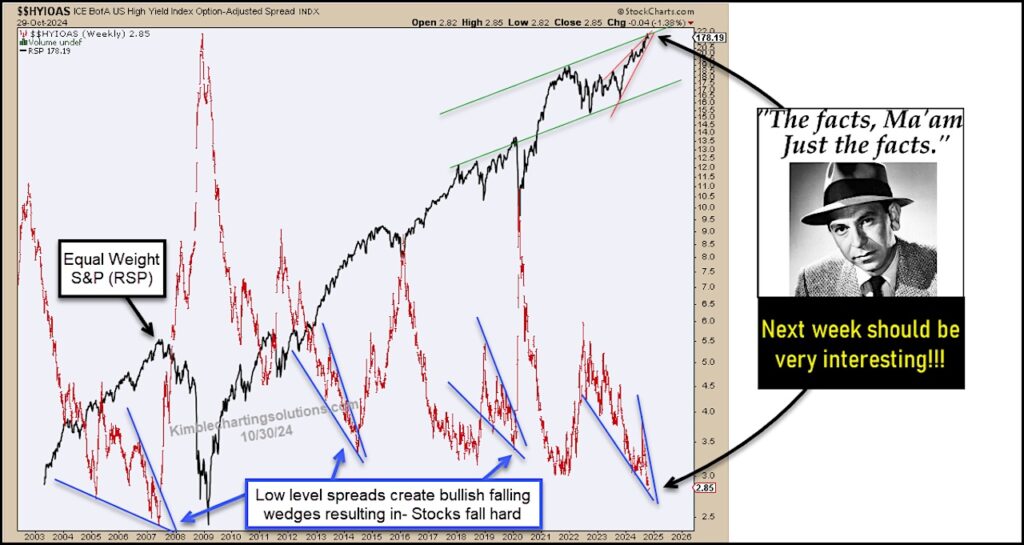
Today we look at a long-term “weekly” chart of the BofA High Yield Option-Adjusted Spreads.
When spreads were low over the past 17 years and formed bullish falling wedges, spreads blew out, and stocks sold off.
Spreads are currently the lowest in 17 years and are forming a bullish falling wedge.
With the elections next week, these patterns could lead to some very interesting price action. Stay tuned!
High Yield Index Option-Adjusted Spread “weekly” chart

Twitter: @KimbleCharting
The author may have a position in mentioned securities. Any opinions expressed herein are solely those of the author, and do not in any way represent the views or opinions of any other person or entity.


