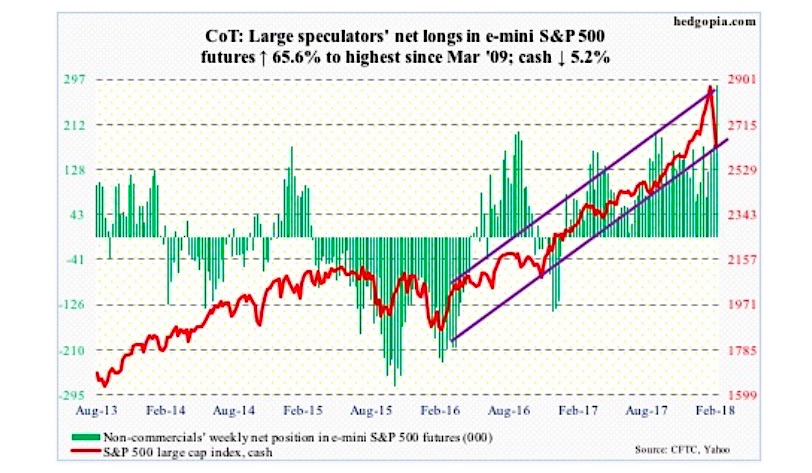
The following chart and data highlight non-commercial commodity futures trading positions as of February 6, 2017.
This data was released with the February 9 COT Report (Commitment of Traders). Note that these charts also appeared on my blog.
The chart below looks at non-commercial futures trading positions for the US Dollar. For the week, the S&P 500 Index was down -5.1%. Speculators may have created overhead supply with record “buy the dip” longs.
E-Mini S&P 500 Futures
February 9 COT Report Spec positioning: Currently net long 286.2k, up 113.4k.
From the January 26th intraday high of 2872.87 through Friday’s low of 2532.69, the cash shed 11.8 percent. That is in 11 sessions! The speed by which stocks have been sold has to be raising concerns in the intermediate term.
Near-term, there will be a bounce/rally. Buyers showed up at the 200-day Friday.
Thursday, only 13.6 percent of S&P 500 stocks were above their 50-day. This compares with nine percent in February 2016, and 4.6 percent in August 2015.
What kind of a bounce and with vigor will depend a lot on if there is any buying power left.
Non-commercials are net long up to the gills, having aggressively added this week.
January saw record inflows in ETF’s. SPY (SPDR S&P 500 ETF), VOO (Vanguard S&P 500 ETF) and IVV (iShares core S&P 500 ETF) alone took in $28.5 billion in that month (courtesy of ETF.com). Some of this optimism is being tempered. In the week to Wednesday, SPY and VOO respectively lost $17.3 billion and $364 million, while $2.7 billion moved into IVV.
During the same week, U.S.-based equity funds (including ETFs) lost $23.9 billion. This follows inflows of $60.7 billion in the prior four (courtesy of Lipper).
Twitter: @hedgopia
Author may hold a position in mentioned securities at the time of publication. Any opinions expressed herein are solely those of the author, and do not in any way represent the views or opinions of any other person or entity.


