The stock market is chugging along climbing a wall of worry… perhaps its biggest wall of worry in some time.
COVID-19, lockdowns, and economic / political uncertainty have had little effect on the stock market thus far.
That said, one industry that seems to be mis-priced (if there is such a thing), is the Transportation Sector. This is best represented by the Dow Jones Transportation Average. With airlines, taxis, ubers, and its dotted-line hotels and hospitality industry (tourism) being shut down, it makes very little sense that the Transports are trading at or near all-time highs.
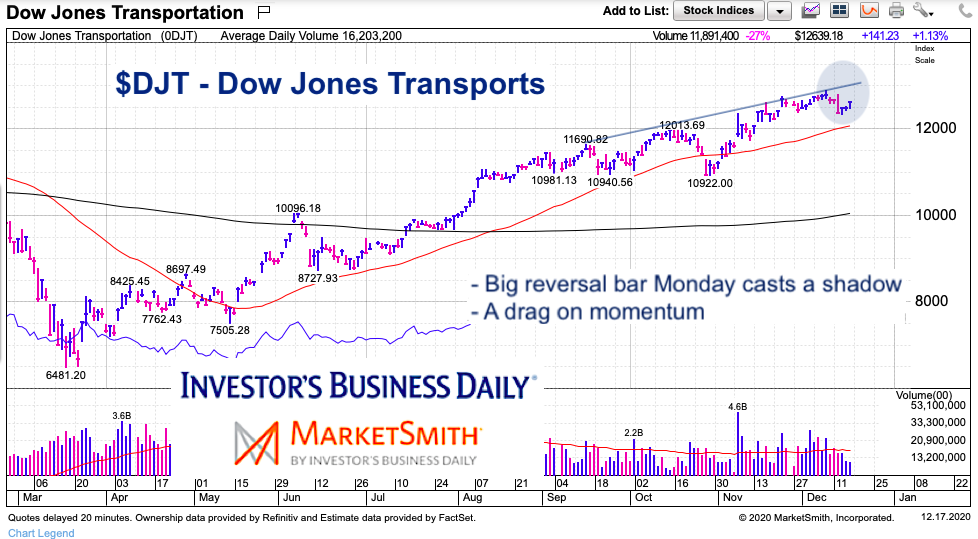
Perhaps this will be the “canary” for a coming stock market correction. Last Monday, the Dow Transports recorded a big reversal price candle. This comes just below overhead trend resistance. While it means nothing without continued selling, it is worth watching.
Note that the following MarketSmith charts are built with Investors Business Daily’s product suite.
I am an Investors Business Daily (IBD) partner and promote the use of their products. The entire platform offers a good mix of technical and fundamental data and education.
Dow Jones Transportation Average Chart
So what should we be watching? First and foremost, the 12,000 area looks important. It is lateral support and the 50-day moving average. A strong break of 12,000 could lead to the 11,000 (major support). In any event, any downturn in the transportation sector would be noteworthy (even if unsurprising).

Twitter: @andrewnyquist
The author may have a position in mentioned securities at the time of publication. Any opinions expressed herein are solely those of the author, and do not in any way represent the views or opinions of any other person or entity.


