One of the key cogs in the economy is the transportation industry. Trains, Planes, and automobile, etc…
So it’s easy to see why the Dow Jones Transportation Average is an important indicator for investors to watch.
And, in my humble opinion, investors need to be watching this stock market index right now.
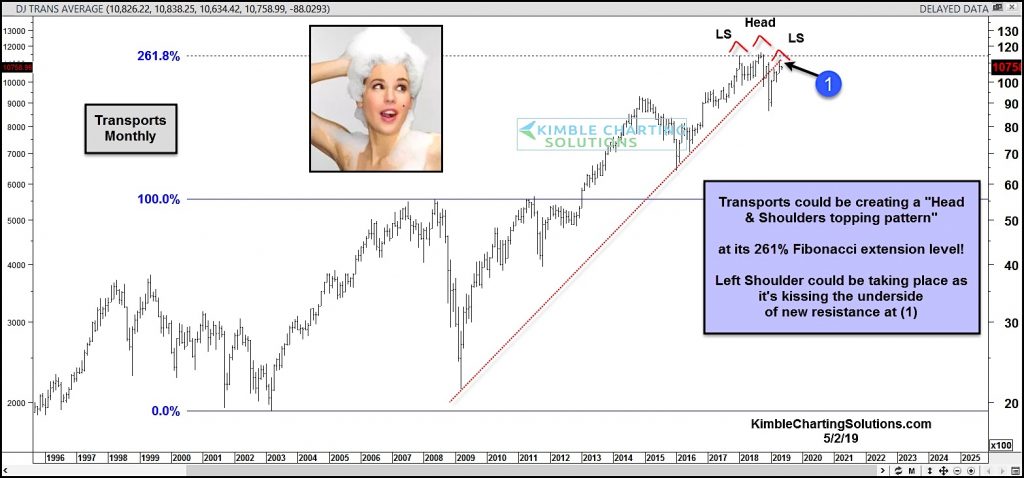
In today’s chart, we zoom out and take a long-term look at the Dow Jones Transportation Average (Dow Transports).
The Transports could be creating a bearish head and shoulders topping pattern at its 261.8 Fibonacci extension level.
The right shoulder could be forming just as its kissing the underside of its broken up-trend line (1).
The confluence of these two resistance points needs to be on investors radars. A breakout here would be bullish, while a breakdown would signal potential trouble in the economy… and the stock market. Stay tuned!
Dow Transports “monthly” Chart

Note that KimbleCharting is offering a 2 week Free trial to See It Market readers. Just send me an email to services@kimblechartingsolutions.com for details to get set up.
Twitter: @KimbleCharting
Any opinions expressed herein are solely those of the author, and do not in any way represent the views or opinions of any other person or entity.


