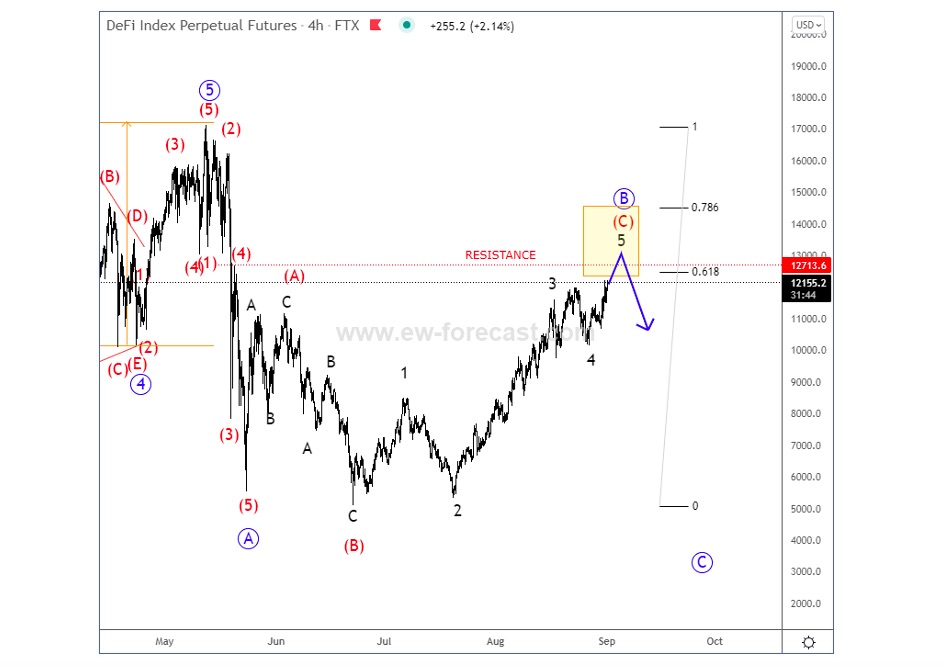
DeFi tokens are making a big recovery, but the DeFi Index appears to be still trading in an (A)-(B)-(C) irregular flat correction within wave B (Elliott wave analysis).
Within this analysis, I am tracking the final 5th wave of a five-wave cycle in wave (C).
Further, I am on watch for a strong price resistance zone here around the 61.8% – 78.6% Fibonacci retracement levels (12k-14k price area).
DeFi Index 4h Elliott Wave Analysis chart
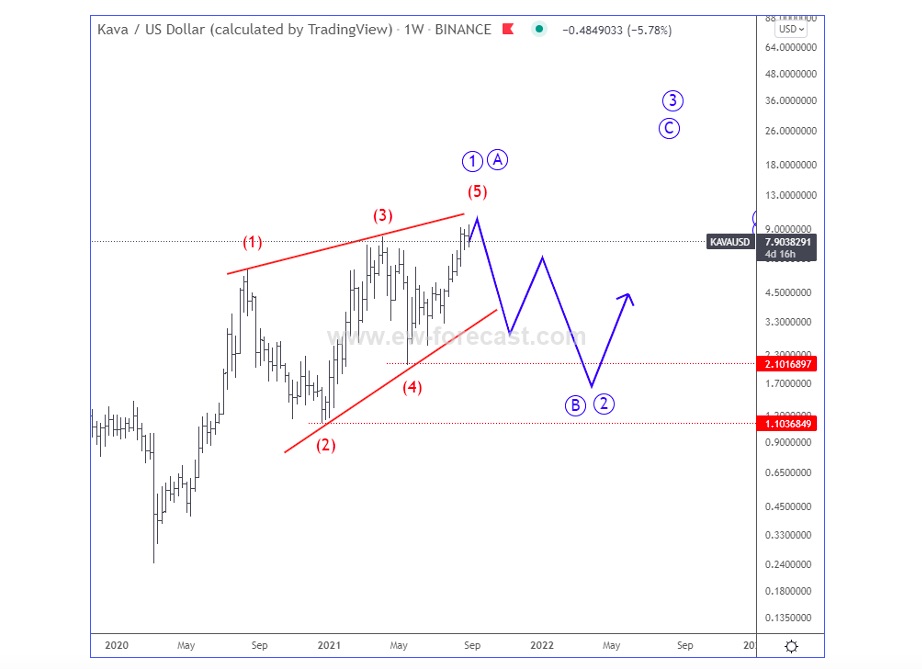
Defi token KAVA came back to all-time highs, but looking at the weekly wave structure, there is a chance it’s finishing a leading diagonal in wave A/1. If that’s the case, then we have to be aware of a bigger and deeper three-wave correction in wave B/2 that can send the price back to 2.1 – 1.1 support zone before a bullish continuation within wave C/3.
KAVAUSD Weekly Elliott Wave Analysis Chart
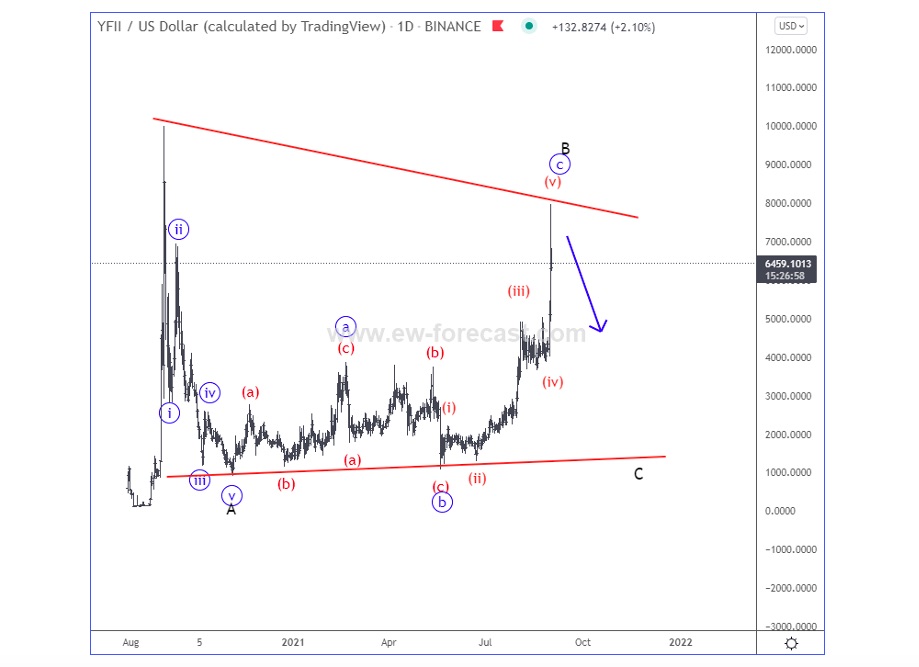
Defi token YFII / US Dollar also made a big spike like some other cryptocurrencies, but it can be still as part of wave (v) of »c« of B, so still watch out for a reversal down into a higher degree wave C either as part of a triangle or maybe even flat that can send the price back down to 2000-1000 or maybe even lower.
YFIIUSD Daily Elliott Wave Analysis Chart
Twitter: @GregaHorvatFX
The authors may have a position in the mentioned securities at the time of publication. Any opinions expressed herein are solely those of the author, and do not in any way represent the views or opinions of any other person or entity.


