Nearly 4 months ago, I wrote a research post on the state of the Crude Oil prices. Here’s a excerpt from that post:
“Consider also watching for price and momentum to be in unison. If you miss the initial entry, a pullback on an intraday basis can offer another opportunity. When all trends line up on a daily and intraday basis, the probability of it continuing in trend is more likely.”
Well, the trends began to align over the past couple of weeks for Crude Oil prices and several related ETFs and markets.
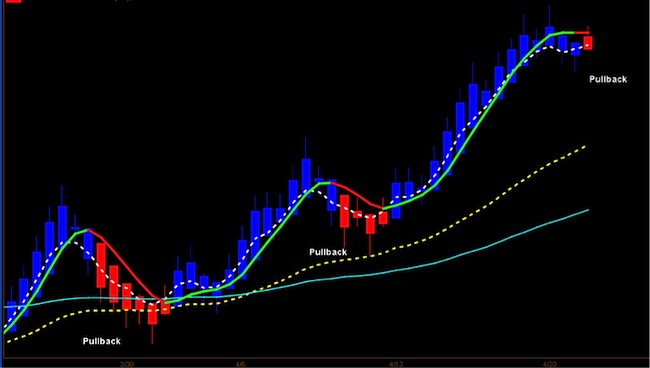
Question is, did you get in at an optimal time or are you waiting for a pullback? It’s all about having some patience and watching for a trend crossover. That will help you get in at an opportune time.
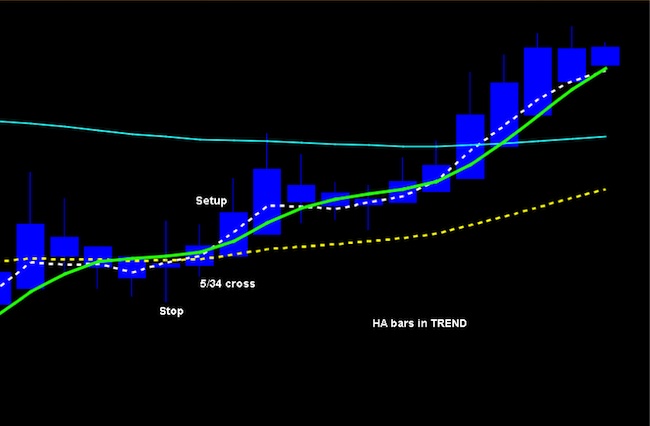
As we can see in the Crude Oil chart with Heikin Ashi bars (below), the trend has turned higher. And while pullbacks can occur at any given time, traders must be patient when looking for re-entry (and maintain good discipline with stops).
How do you optimize this strategy? Wait for entry after a pullback and use the Heikin Ashi bars to help put you in the trade with moving average crossovers. This can work for swing or intraday traders.
With a variety of options to choose from on the oil ETFS/ETN’s, the same scenario is analyzed and played out chart after chart in the following video analysis. Looking for the pullback on a smaller time frame will help to ensure that your timing and risk reward align.
In the video below I discuss the current trends of several ETF’s and futures. Hope you enjoy it.
Thank you for viewing. Have a great week.
Follow David on Twitter: @TradingFibz
The author has no positions in any of the mentioned securities at the time of publication. Any opinions expressed herein are solely those of the author, and do not in any way represent the views or opinions of any other person or entity.


