Our day to day expenses have been wrapped up in plastic and auto/electronic payments tied to plastic.
By plastic, of course I mean credit cards. Cash has become a way of the past.
Understanding this, most investors know that credit card stocks like Visa NYSE: V and Mastercard NYSE: MA are pretty good indicators for how the global economy is performing.
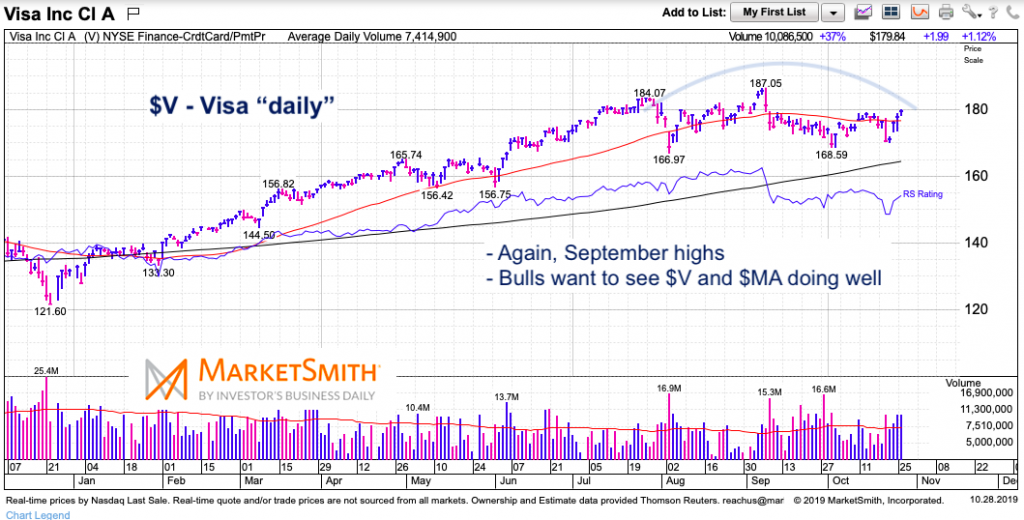
Today, we’ll look at stock charts of V and MA, along with the Dow Jones Industrial Average to get a glimmer of what we are waiting on in terms of a major breakout. In short, Visa and Mastercard have been consolidating since peaking in September (and bulls need them to start moving higher again).
Note that the following MarketSmith charts are built with Investors Business Daily’s product suite.
I am an Investors Business Daily (IBD) partner and promote the use of their products. The entire platform offers a good mix of technical and fundamental data and education.
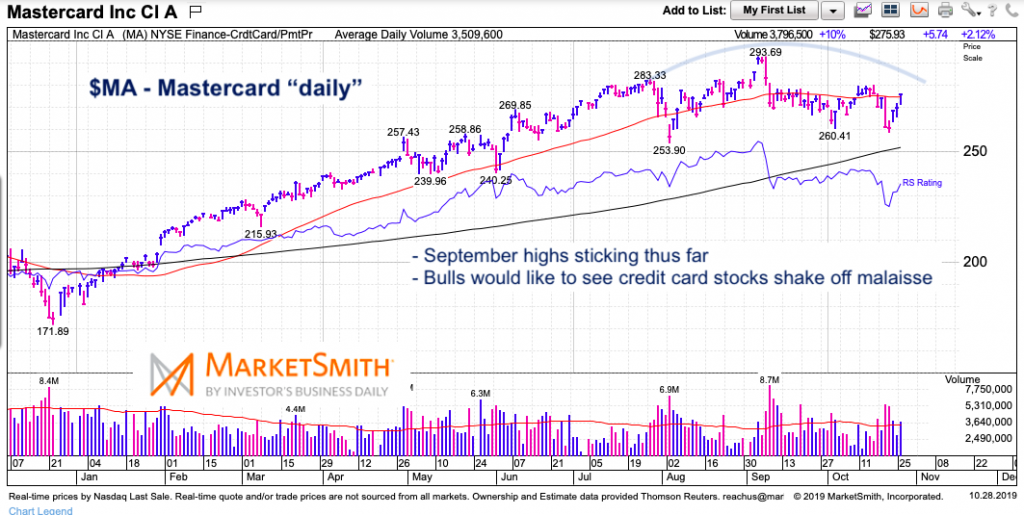
$MA – Mastercard “daily” Chart
Pretty simple. Mastercard (MA) peaked in September and bulls really want to see these big credit card stocks (and symbols of the global economy) keep pushing higher.
$V – Visa “daily” Chart
Ditto with Visa (V). Keep an eye on these two.
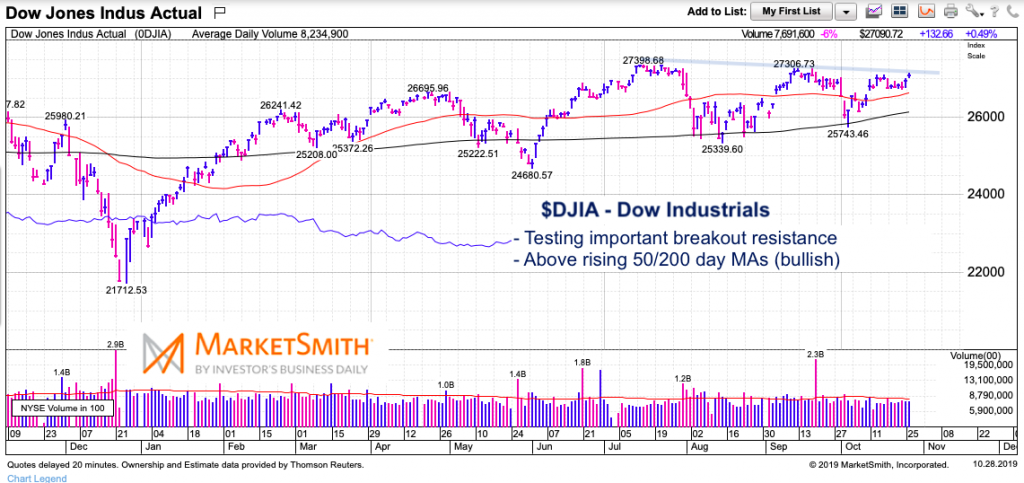
$DJIA – Dow Jones Industrials “daily” Chart
These are international companies, so let’s check out an international index – the Dow Jones Industrial Average. As I mentioned last week, we have yet to see a confirmed breakout above trend resistance. First resistance is 27,300. But perhaps 27,600 is more important as it draws the line of the tops back to 2018 (on weekly chart – shared on my twitter feed)
Twitter: @andrewnyquist
The author may have a position in mentioned securities at the time of publication. Any opinions expressed herein are solely those of the author, and do not in any way represent the views or opinions of any other person or entity.
11/1/19 Editor’s Note: Added question mark to Title

