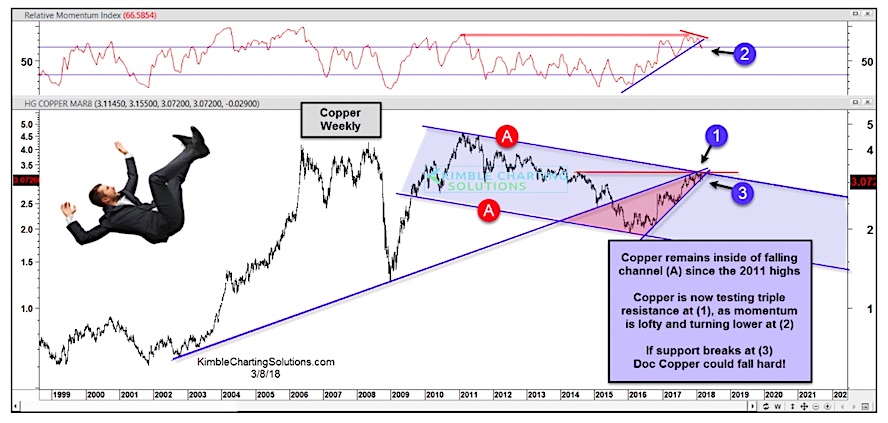
After a strong 2 year rally, Copper prices are showing signs that momentum is slowing.
Perhaps the copper rally is running out of steam.
In the chart below, we take a look at what’s happening with copper over the long and short term.
Despite the 2-year rally, copper prices are still trading within a declining channel that developed following the 2011 highs (see points A).
As well, copper is currently testing a confluence of price resistance at Point 1 while momentum is turning lower (see Point 2).
A slip below the two-year rising rally trend line (Point 3) could lead to much lower prices. Bulls better regroup soon or next move could be lower.
Copper Prices – Long-Term Chart
Twitter: @KimbleCharting
Any opinions expressed herein are solely those of the author, and do not in any way represent the views or opinions of any other person or entity.


