Will October see a volatility spike?
We’ve been trading in extremely low volatility for some time… so this is a fair question. Especially because one of my favorite ratios (indicators) is flashing caution here.
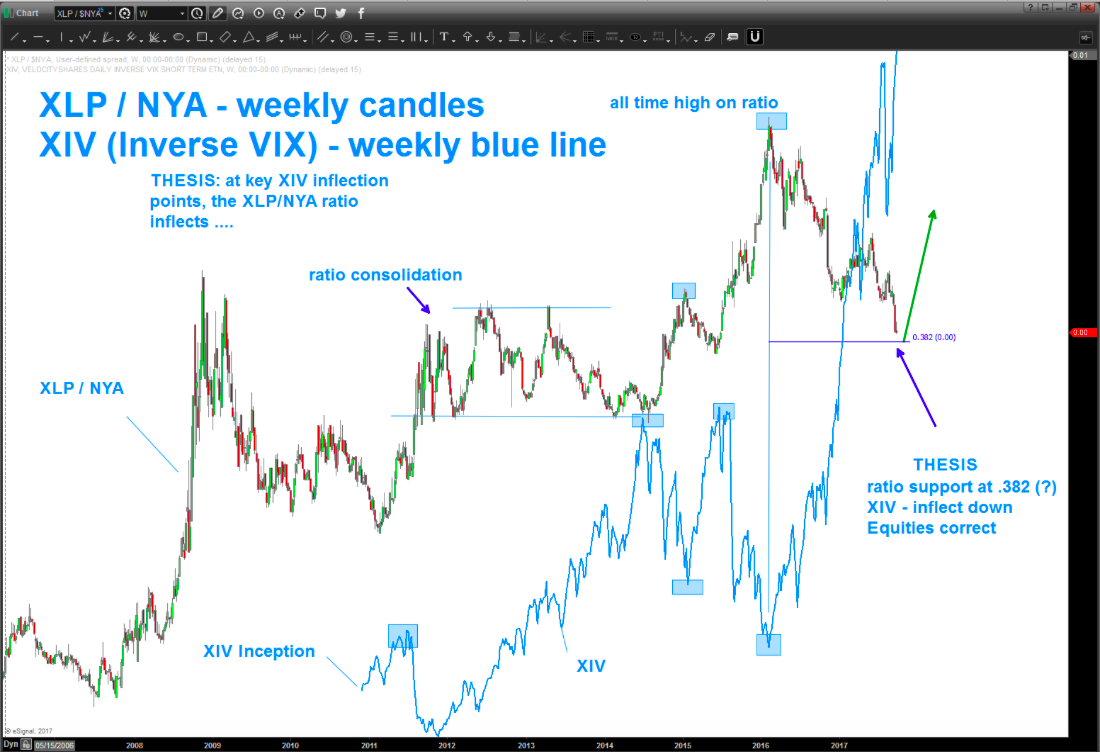
That’s the ratio of Consumer Staples ETF (XLP) to NYSE Composite (NYA). When the “staples” underperformance hits extremes, we tend to see volatility.
If the XLP/NYA ratio finds support and appears to end an A-B-C correction THEN we ‘should’ see Volatility Spike and correspondingly a nice correction in equities. If this level fails, then we might see some consolidation or a little pullback but nothing that could spook the masses.
It should be noted that right now we are at levels of bullishness (as measured by market vane) that we haven’t seen since… yes, you got it the 2007 top.
A plunging liquidating sell-off should, ultimately be bought .. as I still don’t think this run is over but I do believe we are long overdue for a nice pullback. With the options expiration and most mutual funds legally bound NOT to sell and be invested at all times I don’t think we’ll see anything till next week, if at all.
Note the chart below ..
- XLP/NYA – candles
- XIV (the inverse of the VIX Volatility Index) blue line
- NOTE: a most inflections of the XIV (up or down) the ratio either led or gave a heads up that volatility would increase or decrease.
- Our thesis is the ratio ‘should’ find support on the .382 from the all time low in 2007 and correspondingly cause an uptick in volatility and a market sell off.
- A CLOSE (WEEKLY) BENEATH THE .382 WILL TARGET A LOWER MEASURED MOVE TARGET. IF THIS HAPPENS EXPECT SOME CONSOLIDATION OR MINOR FITS AND STARTS BUT NOTHING TO KNOCK YOUR SOCKS OFF. WOULD WAIT TO SEE WHAT HAPPENS A LITTLE LOWER IN THE RATIO.
Thanks for reading.
Twitter: @BartsCharts
Author does not have a position in mentioned securities at the time of publication. Any opinions expressed herein are solely those of the author, and do not in any way represent the views or opinions of any other person or entity.


