The Chinese stock market has struggled mightily over the past several weeks and months.
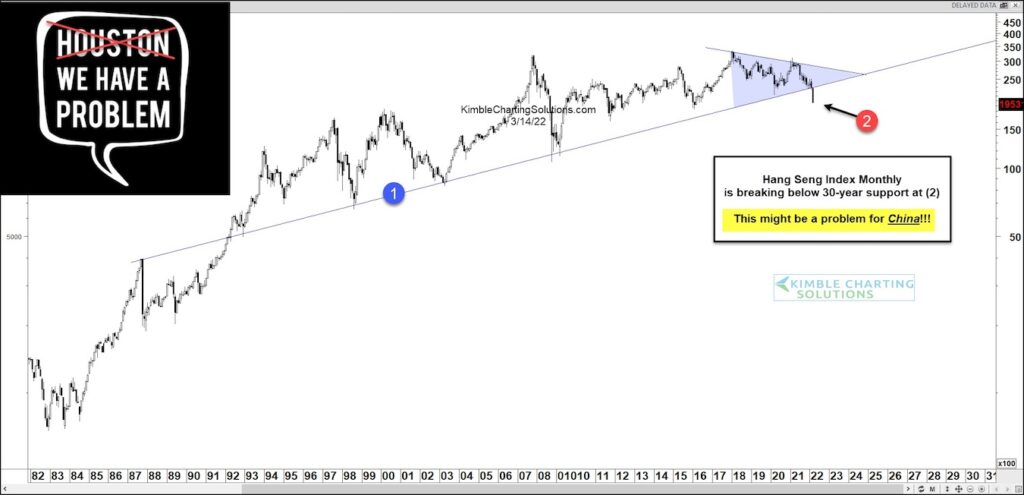
And today’s “monthly” chart of the Hang Seng Index highlights this. For those that missed it, we shared this chart last month as the index was testing critical up-trend support and wondered if the world was watching?
As you can see in the chart, price has broken below the long-term up-trend line marked by (1) and appears to be headed lower at (2).
This might be a problem for China… and Chinese investors… and the global financial markets! China has become global financial leader, so we should all stay tuned!
Hang Seng Index “monthly” Chart

Note that KimbleCharting is offering a 2 week Free trial to See It Market readers. Just send me an email to services@kimblechartingsolutions.com for details to get set up.
Twitter: @KimbleCharting
Any opinions expressed herein are solely those of the author, and do not in any way represent the views or opinions of any other person or entity.


