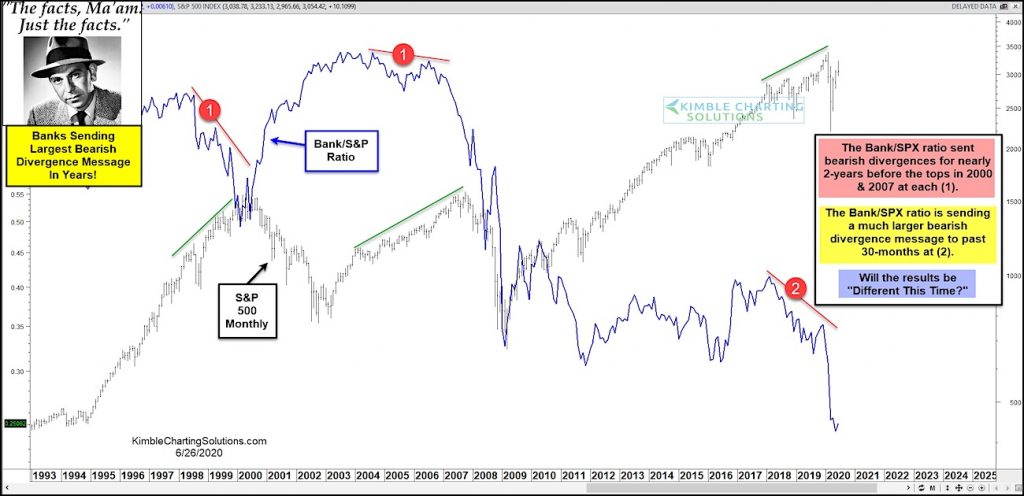
Bank Index to S&P 500 Ratio “monthly” Chart
When the economy is humming along, the stock market tends to out-perform. And one sign of a strong economy is a healthy banking sector.
On the flip side, when the economy is struggling, the banking sector lags. And this is a drag on the broader stock market.
Today’s chart has Joe Friday concerned that the latter scenario may be playing out… and another bear market may be lurking.
As you can see, the Bank Index to S&P 500 ratio has been an important indicator for stocks. In both 2000 and 2007, bank stocks underperformed for nearly 2 years before taking the broader stock market lower. This divergence can be seen at each point (1) on today’s chart.
Note that each of these divergences eventually lead to a major bear market.
The same (or worse!) divergence is rearing its head today at (2). Over the past 30 months, the Bank Index has grossly underperformed the S&P 500. Will this ominous warning bring a second wave of selling in 2020?
If past is prologue, investors should be careful here. Stay tuned!
Note that KimbleCharting is offering a 2 week Free trial to See It Market readers. Just send me an email to services@kimblechartingsolutions.com for details to get set up.
Twitter: @KimbleCharting
Any opinions expressed herein are solely those of the author, and do not in any way represent the views or opinions of any other person or entity.


