 By Andrew Nyquist
There’s been plenty of weekend speculation about Apple (AAPL) and it’s late Friday rally. Some are speculating that it’s a lasting bottom, while some are saying that it’s simply false hope. So what is it?
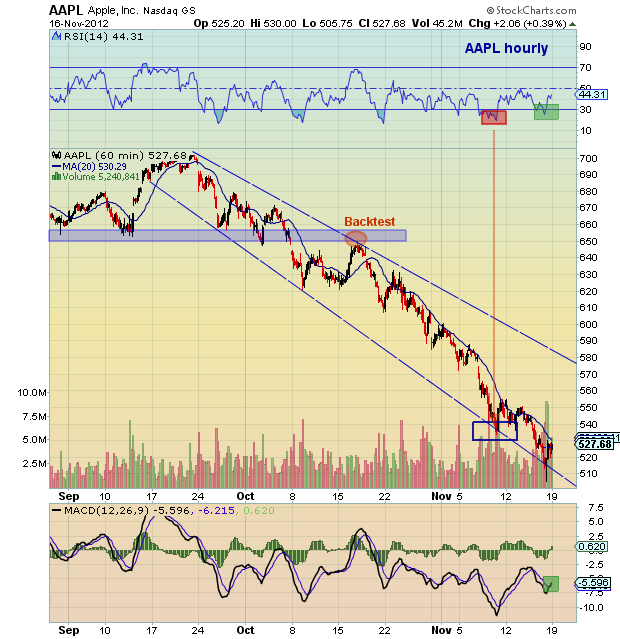
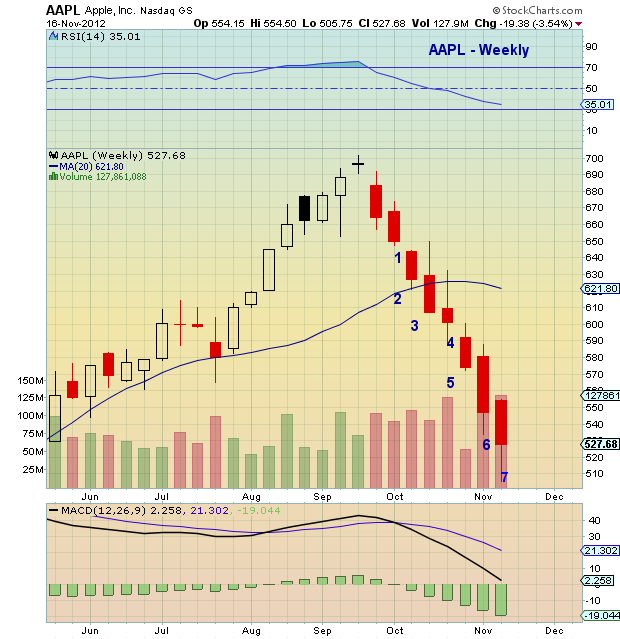
Well, it is a rally, but probably an easier one for traders to game than investors. This is best illustrated looking at the 60 minute vs weekly charts below.
On the 60 minute chart, there was a nice RSI divergence with follow through. As well, the low on Friday punctured the lower channel line and bounced hard. Both signs of short term rally. Looking at the weekly chart below and providing some DeMark setup count overlay, it is easy to see that the stock is oversold (and ready for a rally), but it also indicates this may not be the bottom. The weekly chart is on bar 8 (this week) of a 9 buy setup. The stock needs a new low this week or next to perfect the setup… or it will likely be perfected later. This is a harder concept for non-DeMark followers to gauge.
But, in short, I own the stock and am long for a short term rally (days), but still looking for a new bottom in late November or sometime down the road in December (if the weekly does not perfect soon).
Trade safe, trade disciplined.
Apple (AAPL) stock charts from November 19, 2012. AAPL technical support and resistance levels with trend lines and technical analysis. AAPL DeMark set up count and analysis.
———————————————————
Twitter: @andrewnyquist and @seeitmarket Facebook: See It Market
Position in AAPL at the time of publication.
Any opinions expressed herein are solely those of the author, and do not in any way represent the views or opinions of his employer or any other person or entity.


