 By Andrew Nyquist
After a huge December to April stock run up that saw every analyst and his brother/sister calling market tops the whole way up (myself included), Apple (AAPL) finally decided to take a breather… but not before every mom and pop retail investor had at least thought about buying, with many getting loud about it in April.
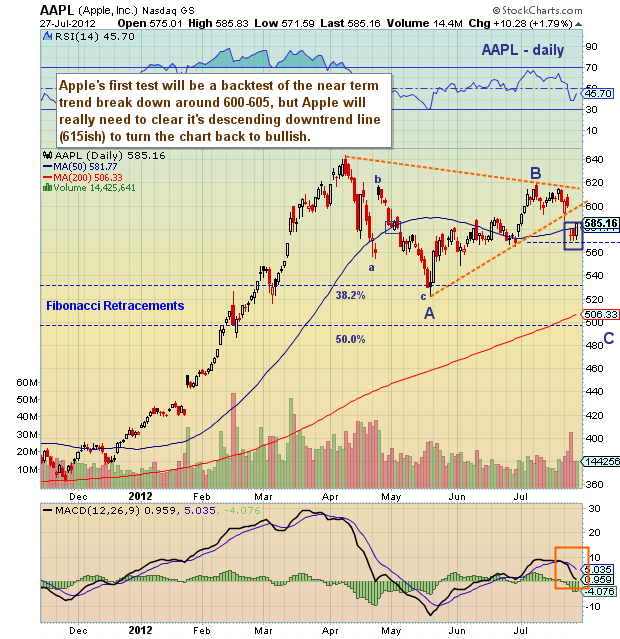
You see, it’s only natural to want in on highflying, euphoric action. Quite simply, no one wants to be left out. Don’t get me wrong, Apple is a wonderful company; I just don’t like chasing and prefer to get in at “discount” prices at technical levels I like. In short, Apple stock fell from a high of 644 in April to a low of 522 in May. This much needed pullback allowed the stock to breathe a bit and for investors to reassess. Back in May I posted two charts on Apple’s near term pullback objective, looking at the .382 fibonacci retracement level of 537, and the A-B-C measured move target of 529. Apple’s intraday low was 522.18 and closing low 530.38 – not too shabby.
From there, the stock rallied back near 620 before selling off after earnings. So that leaves a few important questions: Was the recent rally just a retest of the highs? If so, where could it fall to next? Or is the recent move higher a sign of new highs to come?
For help answering these questions, we’ll need to look at the technical charts and consider a few important near term technical levels:
1. The broken near term trend line – Apple broke below its near term uptrend line after its recent earnings miss. It is now (today) technically backtesting this line (currently around 600 and ascending). A break above would be a bullish sign.
2. The larger picture downtrend line – When Apple couldn’t mount 620, it formed a pretty clear downtrend line and wedge formation. If the stock can clear the backtest (lower wedge line) AND the larger picture downtrend line, then the bulls will be back in business.
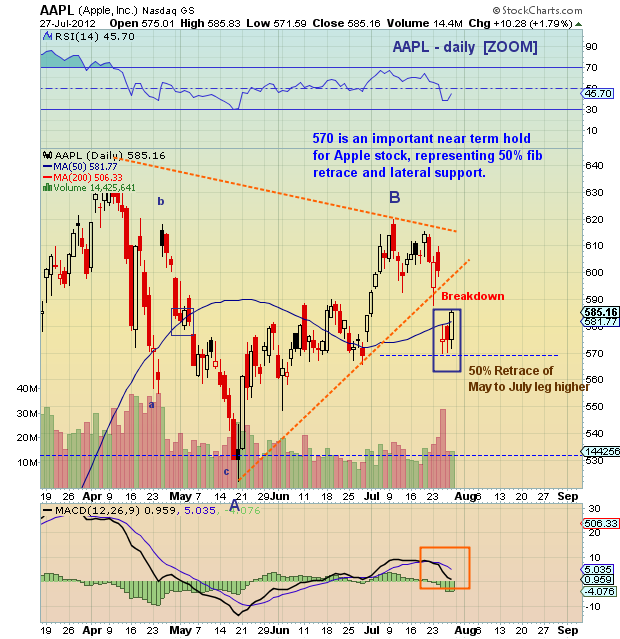
3. 570 Support – This is the 50% fibonacci retracement level of the May to July up move. It is also the late June closing pivot higher and lateral support. In short, a sustained break of the 570 support area would hint at lower prices. So, in summary, if Apple fails to sustain a break above the larger picture downtrend line, then investors should watch 570, for a break of this level could usher in the possibility of a larger picture A-B-C move, making the initial A-B-C move a fractal).
See technical charts below.
Apple Daily Chart:
Apple Daily Stock Chart (ZOOM):
Trade safe, trade disciplined. Have a great week.
———————————————————
Twitter: @andrewnyquist and @seeitmarket Facebook: See It Market
No position in any of the securities mentioned at the time of publication.
Any opinions expressed herein are solely those of the author, and do not in any way represent the views or opinions of his employer or any other person or entity.


