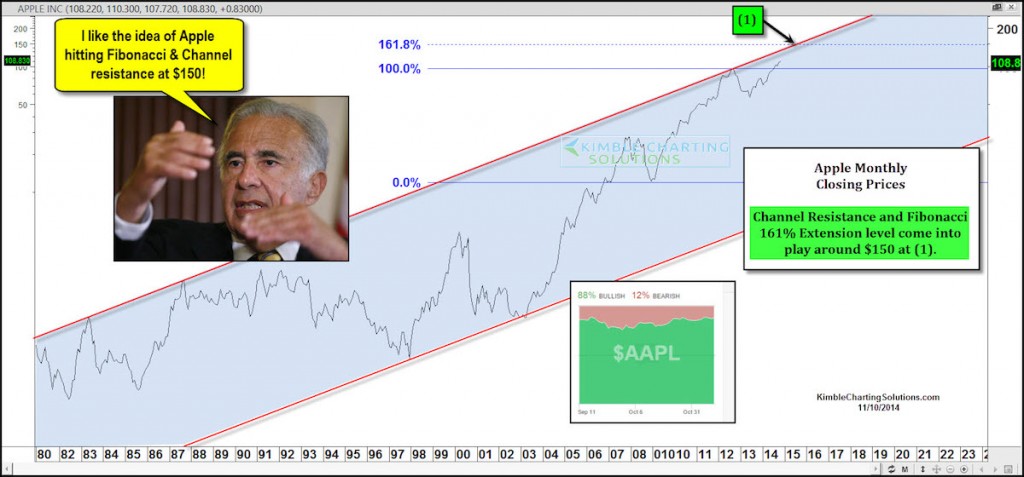
Over the past 4 weeks, Apple stock has rallied from $95 per share to nearly $110. And in the interim, it broke out above technical and psychological resistance at $100. This breakout probably has some investors wondering how high Apple’s share price can go.
Below is a chart of Apple (AAPL) looking back over the past 3 decades. Note that Apple has remained inside of a long-term rising channel for the better part of the past 20 years. The top of this channel was last touched at the 2012 highs. Two key highs and lows took place over the past 10 years for Apple stock price: $12 low in 2006 and $95 high in 2012. Could this long-term rising channel resistance and Fibonacci extension level (around $150) come into play in Apple’s future? Both meet at the green shaded (1) in the chart below… in and around the $150 level.
It’s also worth noting that Apple has once again began to outperform the Nasdaq 100 Powershares QQQ Trust ETF (QQQ). This could portend good things.
Apple Stock (AAPL) Long-Term Trend Channel
If Apple hits this level, I suspect Carl Icahn and other Apple stock investors will be pretty happy campers! Thanks for reading.
Read more from Chris on his Blog. Follow Chris on Twitter: @KimbleCharting
No position in any of the mentioned securities at the time of publication. Any opinions expressed herein are solely those of the author, and do not in any way represent the views or opinions of any other person or entity.


