 By Andrew Nyquist
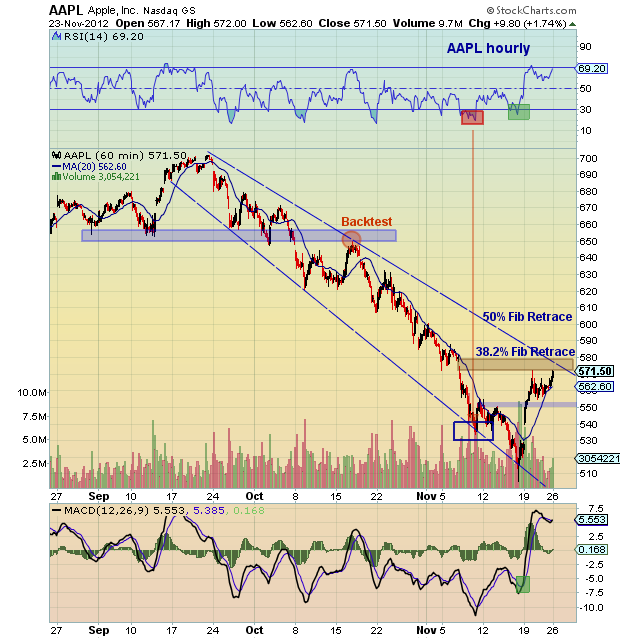
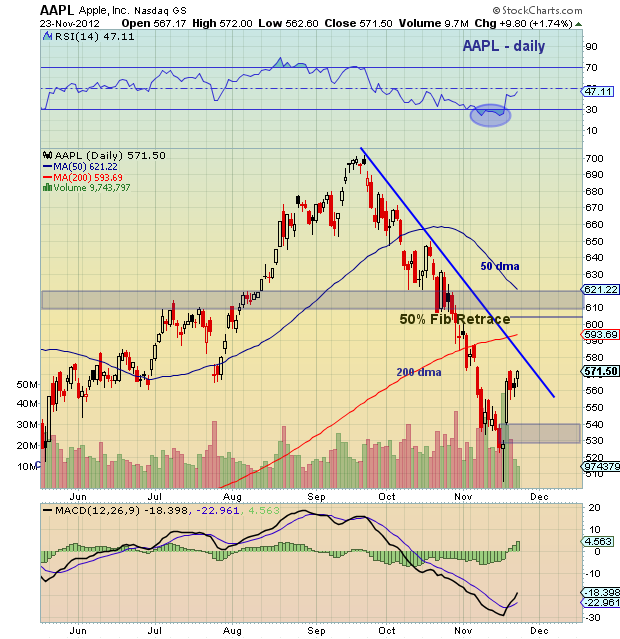
Quick update on Apple (AAPL). The stock has been on fire but is nearing a confluence of resistance points: its downtrend line, the 38.2 percent Fibonacci retracement level, and the open gap area. If the stock can power through this resistance, the next stop would likely be the 50 percent Fibonacci retracement level and previous congestion area between 605 and 615.
See 60 minute and daily bar charts below. See previous Apple stock update.
Trade safe, trade disciplined.
Apple (AAPL) stock charts as of market close November 23, 2012. AAPL technical support and resistance levels with trend lines and technical analysis. AAPL DeMark set up count and analysis.
———————————————————
Twitter: @andrewnyquist and @seeitmarket Facebook: See It Market
No position in any of the securities mentioned at the time of publication.
Any opinions expressed herein are solely those of the author, and do not in any way represent the views or opinions of his employer or any other person or entity.


