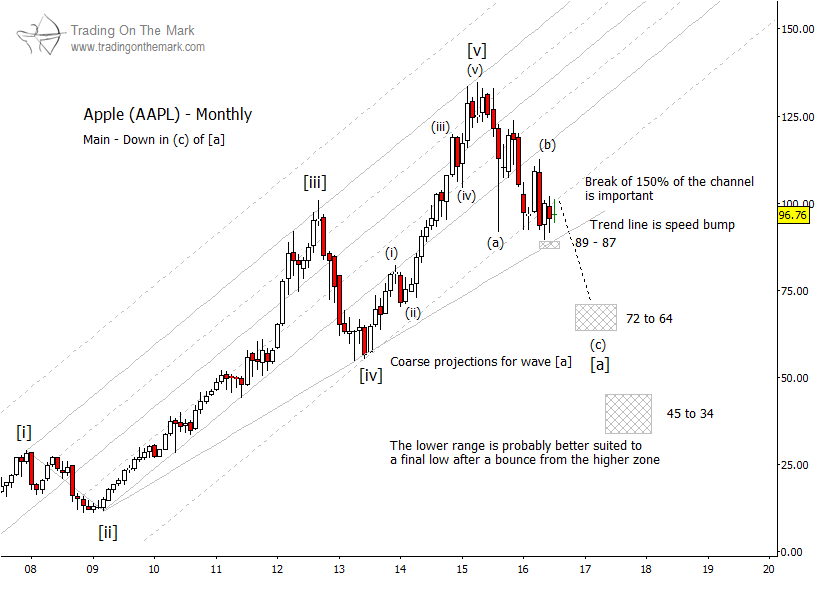
In May, we noted that shares of Apple, Inc. (NASDAQ:AAPL) were testing an important trend line. In that post, the trend line represented potential support, although we suggested it would be broken (i.e. head lower).
During the three months since then, Apple’s stock price has spent more time beneath the line, which must now be regarded as potential resistance.
It appears that AAPL is preparing for the next step lower in its decline – something we are provisionally treating as sub-wave (c) of larger downward wave [a] of an even larger corrective move. Regardless of the details of the downward Apple Elliott wave pattern – which we will be able to confirm only in hindsight – the move lower probably will start from near the present area.
Apple Stock Chart (AAPL) – Monthly
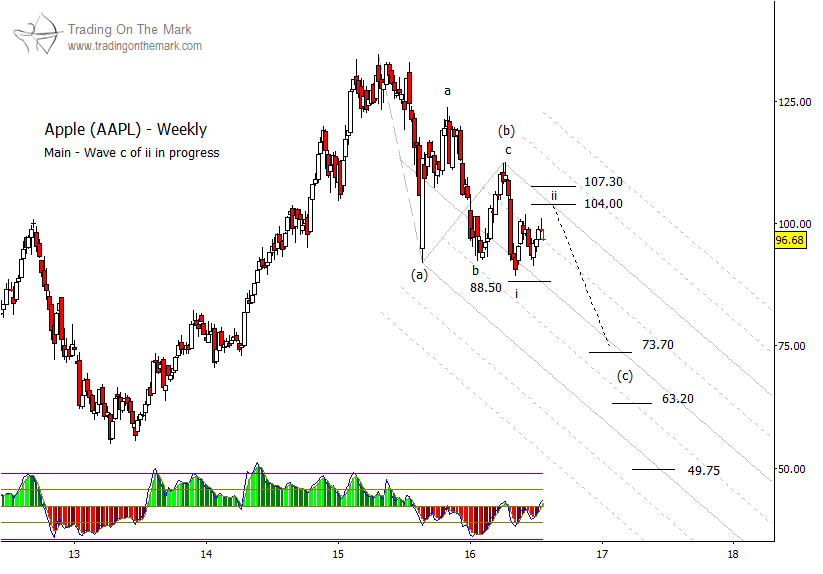
If the next downward wave with the Apple Elliott wave pattern is impulsive (consisting of five waves without overlap), then we can bring additional technical analysis tools to bear. For example, impulsive waves usually recognize the boundaries of a channel that is defined by earlier high and low points.
On the weekly chart below, you can see how a speculative downward channel might interact with Fibonacci-based retracement and support levels. A test of the 104.00 price area as resistance would be slightly above the support/resistance line on the monthly chart, but it would fit nicely with a potential channel on a weekly time frame.
Apple Stock Chart (AAPL) – Weekly
Start your subscription to Trading On The Mark, and get charts with more potential trade setups in stock indices, currencies, metals, and crude oil. Thanks for reading.
Twitter: @TradingOnMark
No position in any of the mentioned securities at the time of publication. Any opinions expressed herein are solely those of the author, and do not in any way represent the views or opinions of any other person or entity.


