Apple investors were pretty reserved heading into Apple’s earnings report on January 27th. While expectations were high, a subpar corporate earnings season had worked its way into investors’ minds and kept expectations (and the stock price) on planet earth. In fact, as Apple (AAPL) headed lower into earnings, many Apple bulls were likely wondering if the quarter was as good as once thought.
It was. And it sent Apple’s stock price flying higher.
AAPL Chart Analysis
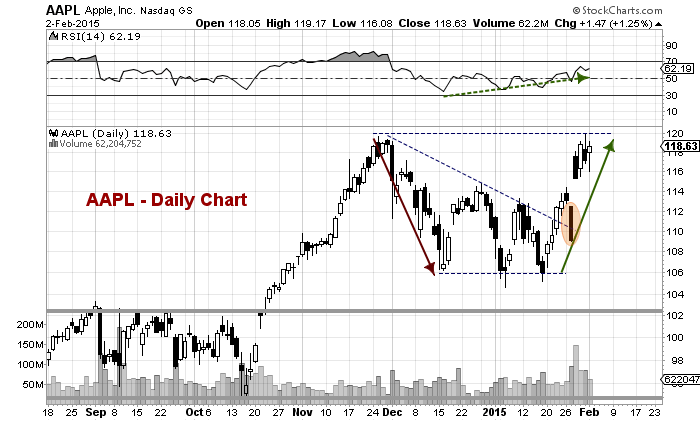
Let’s start with the daily chart. You can see the head fake lower into its earnings report. Apple crushed earnings and the stock headed back to test its all-time highs. Note that its Relative Strength Index (RSI) has turned higher (but Apple bulls will need to monitor this – keep reading).
Apple (AAPL) Daily Chart
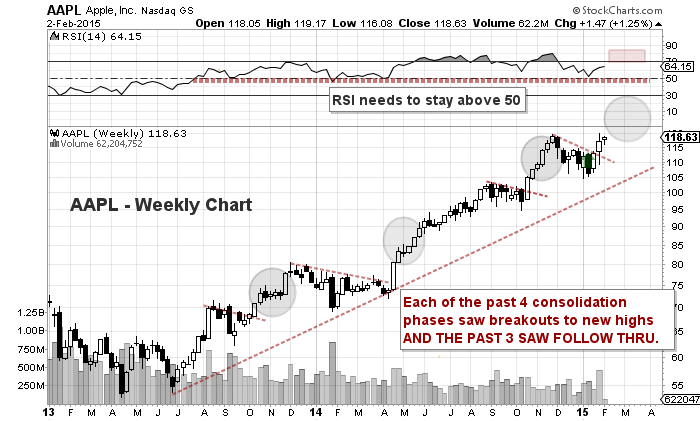
The daily chart only tells part of the tale. If we widen our lens to a weekly chart (see below), we get a better perspective on Apple as an investment. And exactly where the stock is in terms of its price trend.
Apple (AAPL) Weekly Chart
Eyeing the chart above, here are 3 things that Apple bulls will want to see in the weeks ahead:
1. Follow Through Buying – Apple has broken out of consolidation phases 4 times (including this one) and in the previous 3 it saw follow through buying.
2. A Weekly RSI Above 50 – The Relative Strength Index (RSI) on the weekly chart below has remained above 50 throughout this leg higher. This is NOT in danger right now, but it’s something to take note of.
3. A Weekly And Daily RSI Back Above 70 – This would take eliminate the possibility of an RSI divergence, where price continues to new highs, but RSI doesn’t.
The most important item on that list for Apple bulls is follow through buying. Thanks for reading.
Follow Andy on Twitter: @andrewnyquist
No position in any of the mentioned securities at the time of publication. Any opinions expressed herein are solely those of the author, and do not in any way represent the views or opinions of any other person or entity.


