I tend to cover Apple’s stock about once or twice a month. Not because I am an Apple (AAPL) stock fanatic, but because AAPL has a large presence in the tech space and investor portfolios. And considering the recent consolidation of Apple’s stock price, it’s probably a good time to revisit the price action.
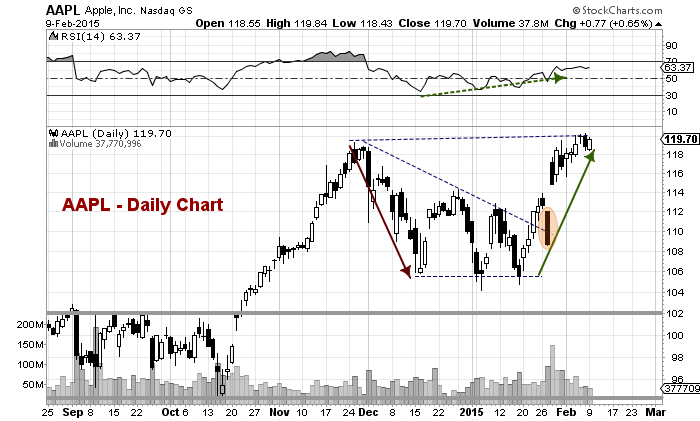
In my last update, I discussed Apple’s big earnings move higher and 3 things that Apple bulls needed to see now. It’s only been a week, but it’s worth noting that the stock is going on day 7 of the AAPL consolidation period near all-time highs. How long can this go on before Apple gets tired and requires a pullback to re-energize?
It’s Relative Strength Index (RSI) is currently at 63 so investors need to be aware of a possible RSI divergence (a new price high and a lower RSI high). That could take several days to develop and still see the stock run higher. For example, if the stock breaks above $120, it could easily move to $130… and if the RSI doesn’t rise significantly above 70, then it would present an area to take profits.
But before we get ahead of ourselves, it’s also worth noting that there’s a big open gap from the earnings report and that leaves Apple vulnerable if the AAPL consolidation period rolls over into a pullback. Alan Farley (@msttrader) mentioned this on Twitter today:
$AAPL in day 6 of testing breakout buyer’s patience. Big gap 110-117 is big pain. Think of it as a magnet on every rally attempt.
— Alan Farley (@msttrader) February 9, 2015
No call here, just a couple of pointers to reinforce using stops for shorter term traders and mental preparation and road-mapping for investors.
Apple (AAPL) “Daily” Stock Chart
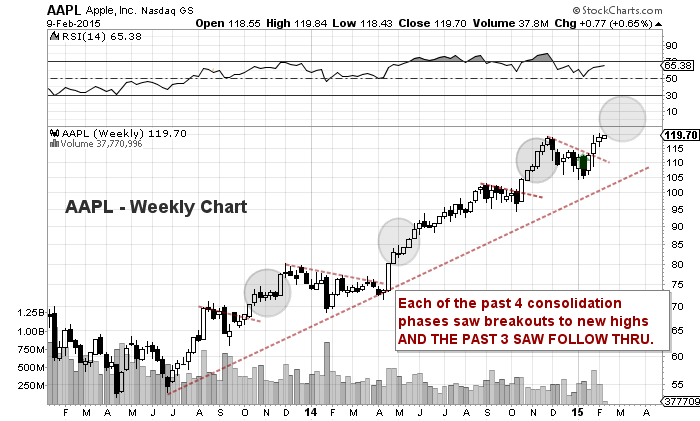
From a pure price standpoint, investors need to see “follow through”. So what does that mean? In short, strong price movement over multiple days into new highs. I wrote an in depth post for Yahoo Finance last week on this very subject.
Directional follow through is always critical on price breakout attempts for any asset. And if you need any further proof, just take a look at Apple’s prior breakouts during this leg higher. Each of the past 3 breakouts has seen follow through action higher.
Apple (AAPL) “Weekly” Stock Chart
Thanks for reading.
Follow Andy on Twitter: @andrewnyquist
No position in any of the mentioned securities at the time of publication. Any opinions expressed herein are solely those of the author, and do not in any way represent the views or opinions of any other person or entity.


