Last fall, we laid out the foundation for the current rally in pharmaceutical and biotech stocks; we take stock of those setups and the sectors’ present prospects.
Some may construe today’s post – and the associated charts of the day – as a victory lap. And while there may be a hint of truth to that, such laps are inherent, at times, when using one’s track record for the purposes of teaching a lesson. In this case, the lesson has to do with objectively seeking opportunity in the midst of careening prices.
Baron Rothschild is the one most often credited with saying that “The time to buy is when there’s blood in the streets.” Now, if you’re a longtime reader of our writings or are familiar with our investment philosophy, that quote probably does not come to mind when considering our investment selections. We are strong advocates of buying relative strength, i.e., those areas of the market that are performing best, not the bloodied ones. That said, there are times when we will wade into mean-reversion type plays because, as we have noted on plenty of occasions, most every falling knife can be caught at some point – some just require more deftness than others, lest it be your own blood running in the streets.
For example, biotech and pharmaceutical stocks are currently among the darlings of Wall Street. However, folks may forget that if we rewind to last fall, they were the whipping boys. However, in the midst of their bloodbaths then, we were able to identify some objective levels on their charts which we felt had a good chance to stop the bleeding. Indeed, those levels set the foundation for the rallies currently at hand.
Pharmaceutical Stocks
Looking first at pharmaceutical stocks, we revisit one of our favorite, under the radar charts of 2016. Not only was the aftermath a smashing success, but the pieces of analysis fit together so well that it produced one of our highest confidence mean reversion setups of the year.
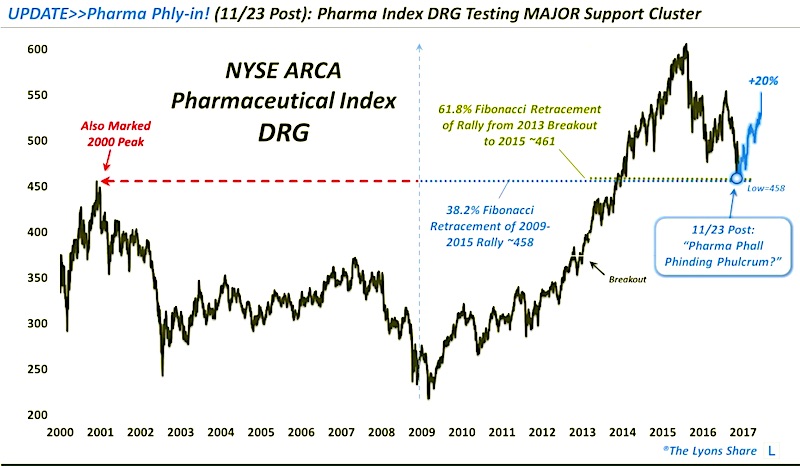
On November 23 of last year, the NYSE ARCA Pharmaceutical Index (INDEXNYSEGIS:DRG) was in free fall, down 25% from its 2015 all-time high, and down 17% in just the past 3 months. It was, however, hitting a compelling confluence of potential support near the 458 area. Among the key levels in that vicinity were:
- The 38.2% Fibonacci Retracement of the 2009-2015 Rally ~458
- The 61.8% Fibonacci Retracement of the Rally from the 2013 Breakout (above 2007 highs) to the 2015 top ~461
- The 2000 former all-time high in the DRG that had held until the 2013 breakout
As we stated in that November post:
“We have been watching this level for a long time as a potential fulcrum, or pivot spot for the DRG, and, perhaps, the health care sector.”
We continued:
“This morning, the DRG fell 2%, bottoming at 459, before bouncing all the way back to close unchanged. This area should at least serve to stop the immediate bleeding in pharma stocks, and perhaps spur a reversal in the health care sector in general.”
Believe me when I say that trade setups do not always work as exquisitely as this one. But 2 weeks later, on December 7, the DRG hit an ultimate low of 458.39 before launching the rally that, as of earlier this week, had gained as much as 20%.
Biotech Stocks
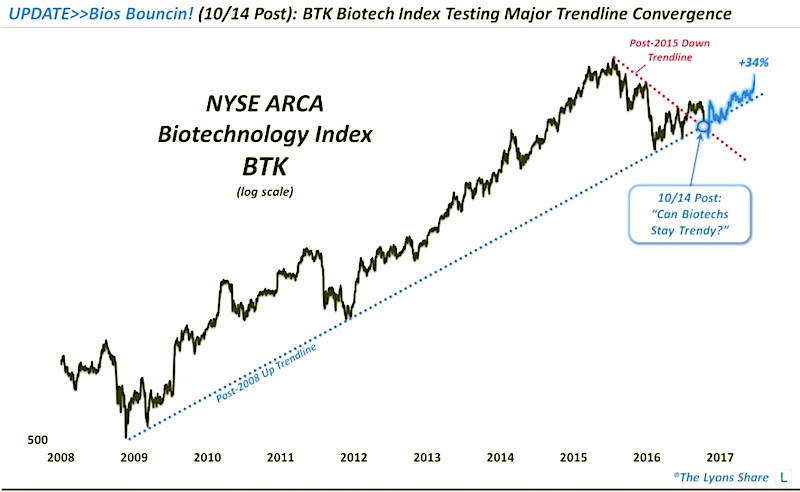
This setup was not as intricate as that of the DRG, but it was effective nonetheless. Like the drug stocks, the biotech sector was also in a shambles last fall. In fact, it was arguably in worse shape after imploding in a potential bubble top in 2015. By early 2016, the NYSE ARCA Biotechnology Index (INDEXNYSEGIS:BTK) had lost over 40% of its value.
One of the few positives was that at both the early 2016 lows and the Brexit lows, the Biotech Index (BTK) had held its post-2009 Up trendline that connected the 2011 lows. On October 14, we wrote a post noting that the index was once again testing the trendline, near the 3000 level at the time. Additionally, the BTK was also testing the topside of its Down trendline from its 2015 peak, which it had broken above in late July.
In our view, the test of the intersection of these 2 key trendlines was enough to warrant consideration in dipping one’s toes into this bloodied sector. As we stated in the October post:
This convergence of trendlines should provide for staunch support in the BTK and biotech stocks – at least in the short-term.
As it happens, the BTK held this 3000 level for a few weeks. In late October, apparently in the fog of a potential presidential election victory by biotech foe Hilary Clinton, the BTK temporarily broke down. However, the index would only spend a few days below that key level before reclaiming it immediately following the election.
As with many false breakdowns, the recovery of the key 3000 level served as a springboard to the ensuing rally that, as of the past few days, has gained as much as 34%.
So what are the prospects for these sectors now following their respective impressive rallies? If one was lucky enough to buy the blood in the streets last fall, should they take the money and run? Or, given the health care sector’s recent breakout to all-time highs (which we documented last week), is this perhaps the beginning of a larger move?
In a premium post at The Lyons Share, we answer those questions (quite clearly). For our Tumblr/YahooFinance readers, we will reiterate today’s lesson. When encountering a market segment that has been bruised and battered – and better yet, wholly dismissed by investors in hysterical fashion – remember to stay objective. When the blood is in the streets, look for MAJOR chart levels with the potential to stop the bleeding. You just may spot the next biotech or pharma-like stars of tomorrow – today.
If you want the “all-access” version of our charts and research, we invite you to check out our new site, The Lyons Share. Thanks for reading.
Twitter: @JLyonsFundMgmt
The author may have a position in mentioned securities at the time of publication. Any opinions expressed herein are solely those of the author, and do not in any way represent the views or opinions of any other person or entity.


