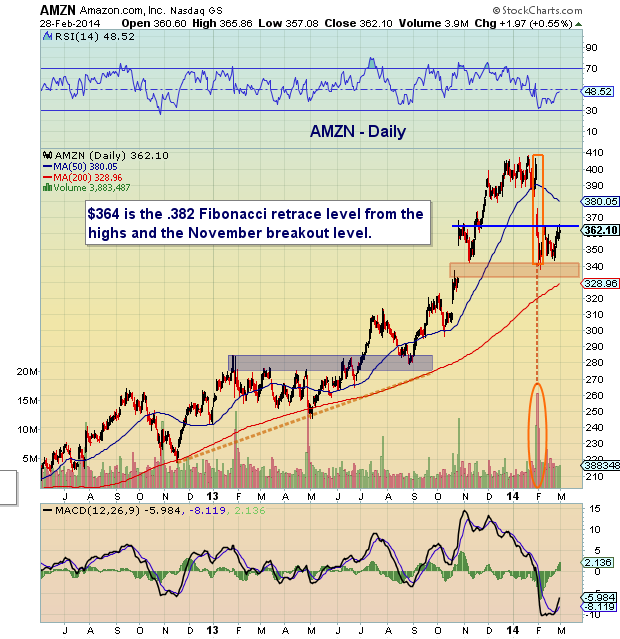
 Amazon’s stock rose almost 5 percent into its January 30 earnings report. Considering that this followed a week of sideways chop, it’s fair to say that the expectations were suddenly elevated heading into earnings… making Amazon’s (AMZN) stock price vulnerable to a miss. And this is precisely what happened, sending Amazon’s stock price plunging after hours, en route to a post-earnings slide that saw as much as 16 percent trimmed off its stock price (using intraday lows).
AMZN was immediately magnetized to its open gap between $332 and $342, This level served as support allowing AMZN to build a base and put together a nice little reflex rally. On Friday, the rally reached up as high as the 38.2 Fibonacci retracement resistance around $364/65. This is a key focal point for traders, as a move above this level would likely target $380/81, the 61.8 Fibonacci retracement, open gap, and lateral resistance (December lows). Next up would be $393 (the 78.6 Fib).
But AMZN isn’t out of the woods by any means. Should the stock price fail at $365 resistance, it will likely retest its post-earnings lows (and potentially push down as low as $330, the lower end of the open gap and 200 day moving average). A move below this level would leave AMZN in a weak position, potentially opening it up for a decline to $270 out of a head and shoulders pattern.
A few other support lower support levels to be mindful of include $311/$317 open gap and intermediate term trend support around $310. Trade safe.
AMZN Stock Chart – Daily
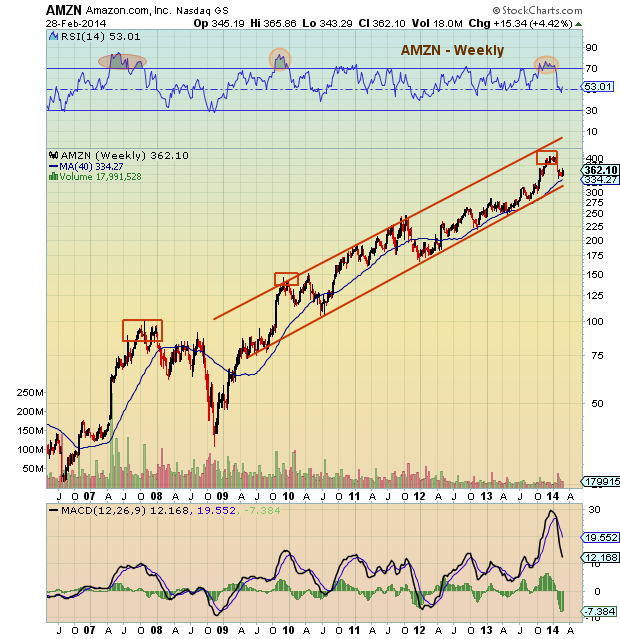
AMZN Stock Chart – Weekly
No positions in any mentioned securities at the time of publication. Any opinions expressed herein are solely those of the author, and do not in any way represent the views or opinions of any other person or entity.


