It always pays to keep an eye on the magnificent 7… I don’t know, maybe there’s 10 now;)
Mega cap stocks have been the center of memes and lead (carried) the market for a while now.
So today, we are going to focus on one of them (Amazon – NASDAQ:AMZN) and highlight why it is at a critical short-term juncture.
Long story short, Amazon (AMZN) is in the midst of a pullback with falling momentum. It’s also testing key price support.
Note that the following MarketSurge charts are built with Investors Business Daily’s product suite.
I am an Investors Business Daily (IBD) partner and promote the use of their products. The entire platform offers a good mix of tools, education, and technical and fundamental data.
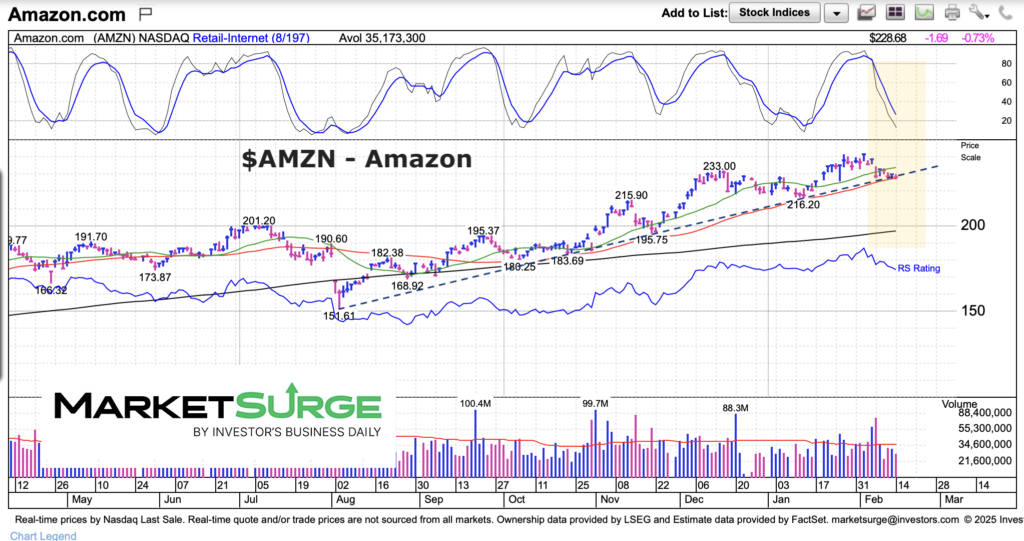
$AMZN Amazon Stock Chart
One could argue that Amazon is an economic indicator as well. So bulls are definitely happy when AMZN stock is trending higher… and concerned when up-trends break.
Below we can see that AMZN is testing its 50-day moving average and short-term up-trend line. This is occurring with falling momentum so bulls will want to keep an eye on this mega cap.
Twitter: @andrewnyquist
The author may have a position in mentioned securities at the time of publication. Any opinions expressed herein are solely those of the author, and do not in any way represent the views or opinions of any other person or entity.


 Trying to Bottom?")


