Amazon (AMZN) fell by as much as 5% on Friday morning, after reporting earnings that beat Wall Street expectations but issuing guidance that missed.
Our analysis of Amazon’s market cycles on both the daily and weekly charts suggests the stock is headed lower over the coming months.
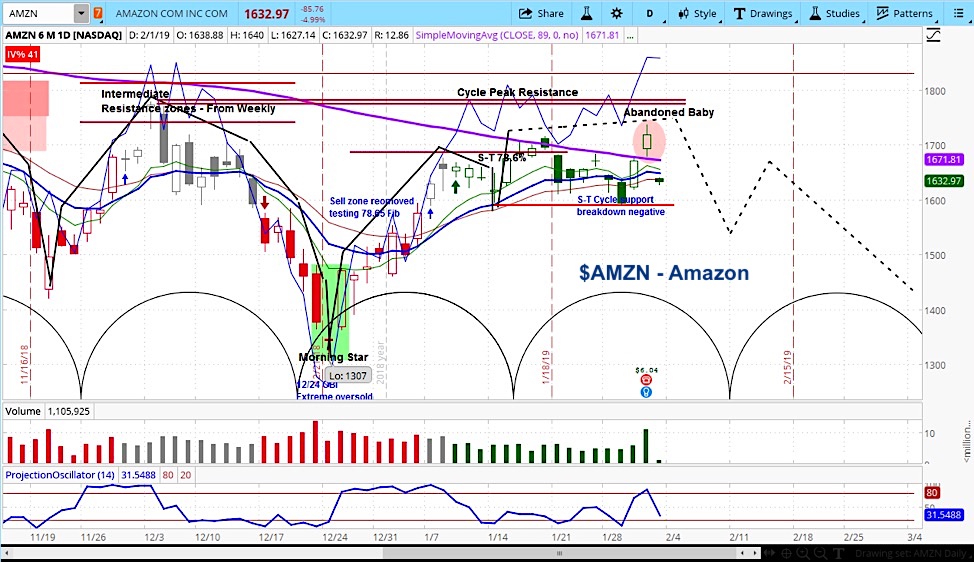
Yesterday’s gap higher and today’s gap lower form an “abandoned baby” pattern on the daily chart (shown below), which often indicates an important reversal in price action.
Amazon Earnings Report
Amazon reported earnings per share of $6.04 and revenue of $72.4 billion, above analyst estimates of $5.64 and $71.9 billion. Management’s guidance for the current quarter came in below the average estimate, which is likely one factor that is pushing the stock lower.
CEO Jeff Bezos did not attend the earnings conference call. But he did highlight in a press release that, “Customers spoke to digital assistant Alexa tens of billions more times in 2018 versus 2017.”
Amazon (AMZN) Stock Analysis with Market Cycles
In today’s article, we feature two stock charts. The first is the daily chart, which shows the abandoned baby.
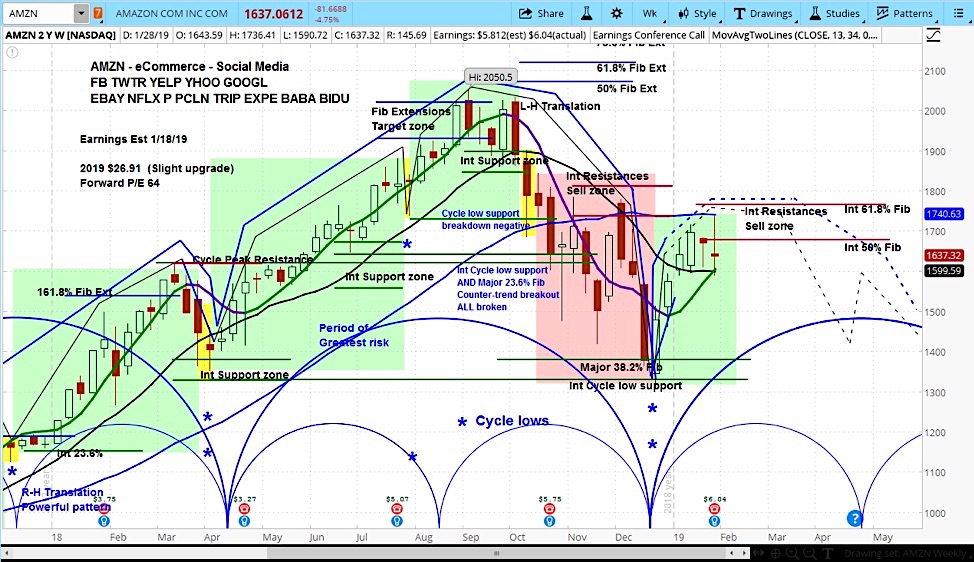
The second is the weekly chart, which shows a failure in our resistance zone, after having built a long term top.
Amazon (AMZN) Stock Daily Chart
Amazon (AMZN) Stock Weekly Chart
Looking at Amazon’s market cycles above, we can see that it was trading in its rising phase and is now likely transitioning into the declining phase.
Our analysis is that the declining phase will continue into April, with a target of $1300 later in the year.
For more from Slim, or to learn about cycle analysis, check out the askSlim Market Week show every Friday on our YouTube channel.
Twitter: @askslim
Any opinions expressed herein are solely those of the author, and do not in any way represent the views or opinions of any other person or entity.


