In fall of 2017, I was becoming a bit disillusioned with the FANG stocks trade.
Sure, this group of stocks had been clear leadership, but I wanted to come up with a group of names with a little more diversity.
The Sierra Alpha Research Bellwether Index was born, comprised of JPMorgan (NYSE: JPM), Visa (NYSE: V), and Alphabet (NASDAQ: GOOGL). Note that this was not a rigorously and scientifically derived list, but rather a group of three stocks that I felt represented some key parts of the economy.
To put it simply, if this group was doing well, I figured the overall market was doing pretty well.
On the other side, if this group ever faltered, then I would expect the broad market would likely suffer as well.
Fast forward to late 2018, which has seen all three stocks rotate from an accumulation phase to a consolidation (a.k.a. sideways) phase. Now all three stocks have faced key support levels. The first has already failed at support, and I suspect the other two are soon to follow.
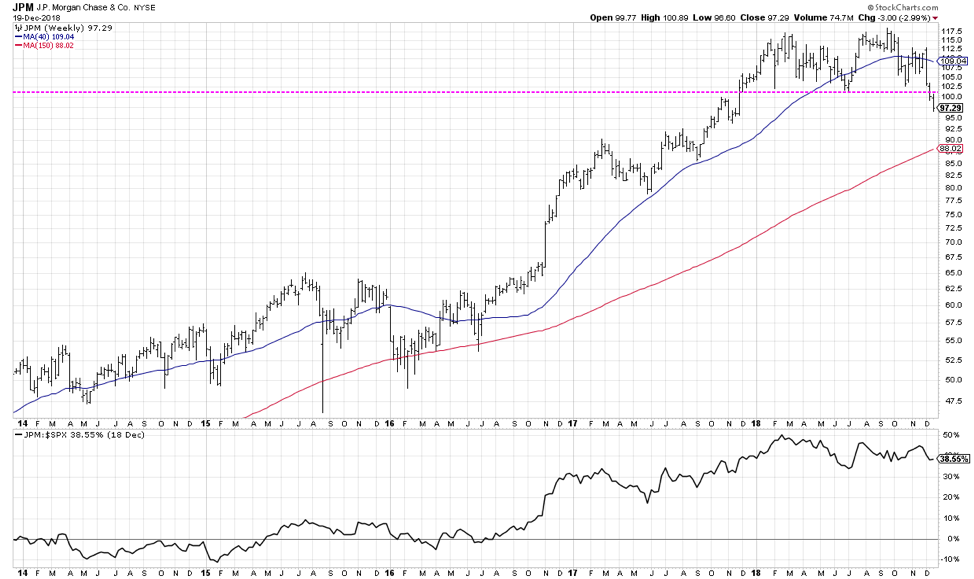
JPMorgan (JPM) pulled back to the $101.50 level in early summer, before returning to all-time highs at the end of July. Over the last three weeks, JPM has weakened along with other banks and has now broken below this key support level.
It’s worth noting that JPM has now also traded below the psychological “big round number” support of $100. Prices tend to cluster around big round numbers because humans assign special relevance to these values. When a stock goes from three digits to two digits, it matters.
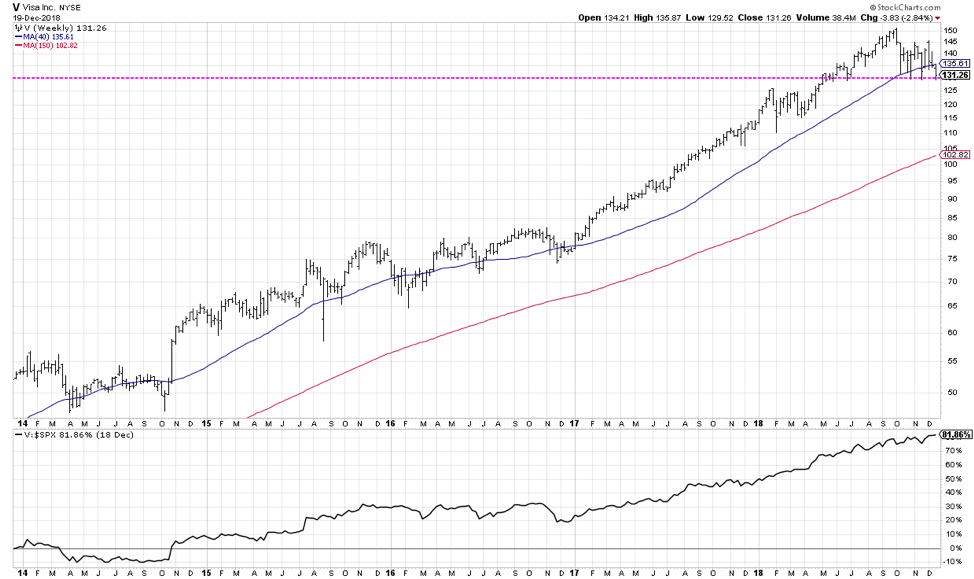
Visa (V) is currently testing price support around $130. One notable difference from the JPM chart is the positive relative strength. While many stocks have already broken to new price and relative lows, Visa has remained above support.
One other issue for Visa is the 40-week moving average, which has been violated three times in the last three months. While that alone is not a sell signal, it does indicate the persistent price weakness that has brought V down to current levels.
Finally, we have what I feel is one of the most important charts to follow into the new year. Alphabet moved to dramatic new highs over the summer, which gave many a false sense of security in terms of market strength.
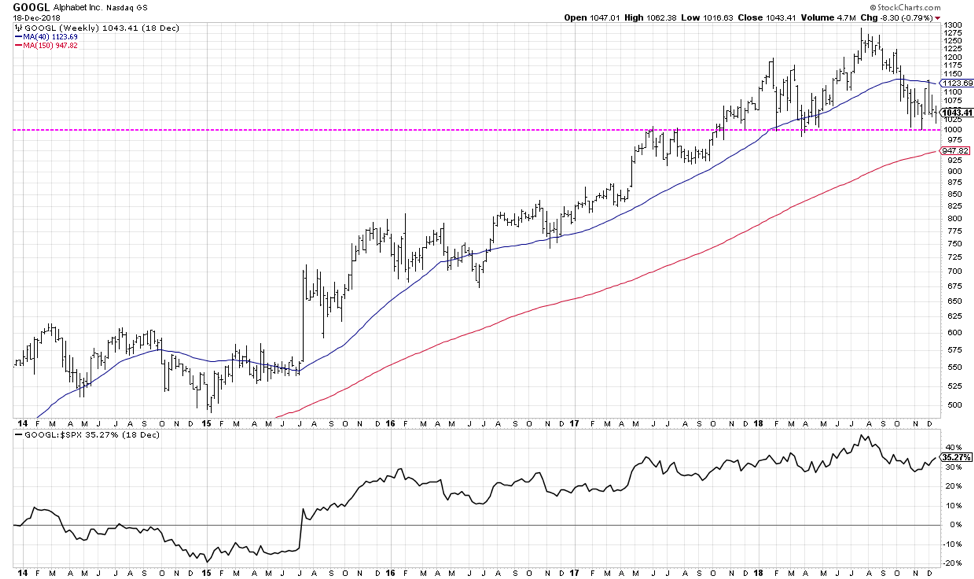
In the last six months, Alphabet (GOOGL) has pulled back to what I consider the “ultimate” support level. $1000. When Alphabet was in a raging bull phase into 2017, the $1000 level stopped the bull trend in its tracks. It took the stock another six months to eclipse this key resistance level.
Alphabet is already broken and retested its 40-week moving average, so its in a more distributive phase than Visa. Note how the relative strength has turned up in recent weeks as the stock has held support while many have already broken down.
So why is the Alphabet chart so important?
When a stock has established such a significant support level, based on both price memory and psychological significance, a violation of that level could be catastrophic.
At the very least, it would be bearish for GOOGL and I would argue bearish for the overall market.
Could these stocks rally from here? Certainly. As a matter of fact, you would expect a rally from support. The real question is whether a short-term bounce is the early sign of leadership, or just a brief respite during an extended bearish move.
The bottom line: when stocks like V and GOOGL are breaking key support levels, it’s time to prepare for further downside.
Learn more about my research over at Sierra Alpha.
Twitter: @DKellerCMT
Any opinions expressed herein are solely those of the author, and do not in any way represent the views or opinions of any other person or entity.


