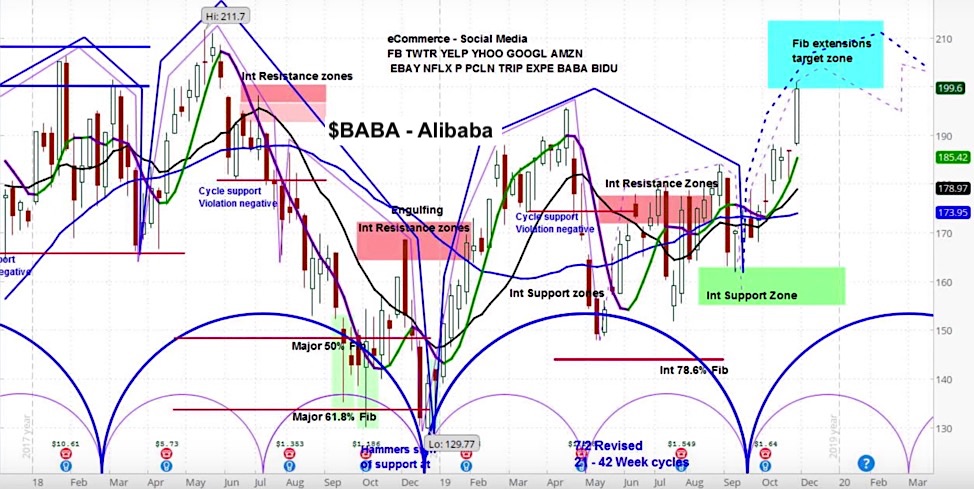
Alibaba (BABA) Stock Weekly Chart
Today I’ll take a look at an individual stock that moved significantly last week – Alibaba NYSE: BABA.
Alibaba (BABA) rose by 7 percent to $200. The stock spiked earlier in the week, after announcing that it launched a secondary listing on the Hong Kong Stock Exchange.
As one can see on the chart above, BABA is clearly in the rising phase of its current cycle.
Based on its Fibonacci extensions, it is approaching its target zone. We believe it will stall between $200 to $205.
For the “Best and Worst Stocks of the Week” check out the askSlim Market Week show every Friday on our YouTube channel.
Twitter: @askslim
Any opinions expressed herein are solely those of the author, and do not in any way represent the views or opinions of any other person or entity.


