 The past couple of weeks haven’t been pretty for Apple (AAPL). The stock has dropped 5 to 6 percent since retesting its December highs. And with this in mind, it’s important to hone in on some key AAPL technical support levels. This may be especially important with options expiration week on deck.
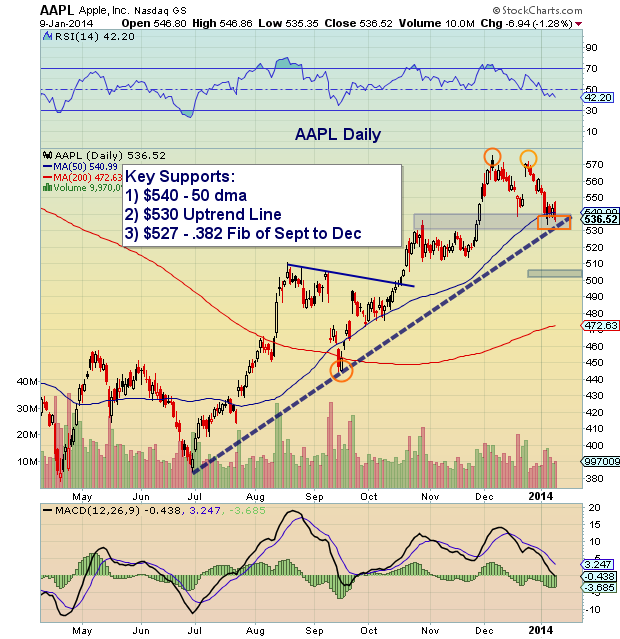
Below is a near-term AAPL technical support chart. In this chart, one major support zone stands out to me (and one potential target):
- $527 to $540 (A confluence of 3 different support levels)
- $500-$510 (Double Top target… if recent lows break)
AAPL Technical Support Levels
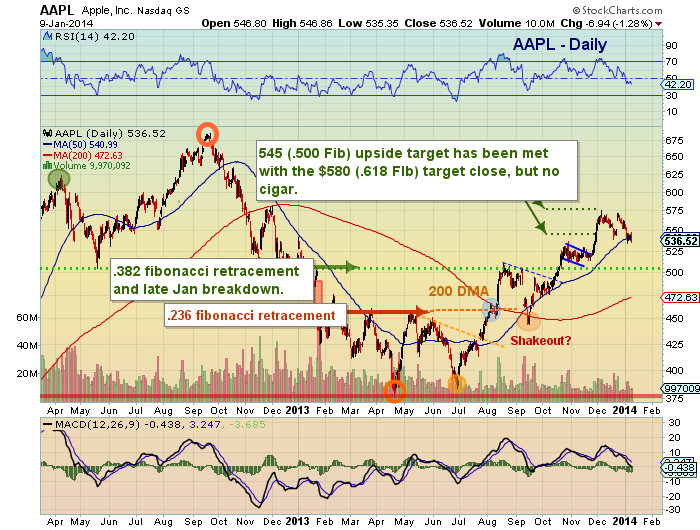
 As I’ve posted in my recent AAPL stock updates, below is a Fib chart. Notice that AAPL reached up (twice) but couldn’t quite tag the .618 Fibonacci retrace level ($582). Trade safe.
Twitter: @andrewnyquist
No positions in any mentioned securities at the time of publication. Any opinions expressed herein are solely those of the author, and do not in any way represent the views or opinions of any other person or entity.


