 By Andrew Nyquist
One of the major market stories over the past several months has been Apple’s (AAPL) fall from grace. And although it’s certainly been overdone, it’s still a great story to learn from; not so much from a technical analysis stand point, but from a herding and greed stand point. Many investors have been hurt, and many have learned that stocks and companies are NEVER invincible, especially those in the consumer trends space. This isn’t to say that Apple’s stock is done-for, just that many calling for AAPL $1000 have had to endure a 38.2% drop from the highs first… and that may not be the end of it. With this in mind, let’s turn to the charts and see if we can identify some key AAPL price levels to watch, including overhead AAPL technical resistance.
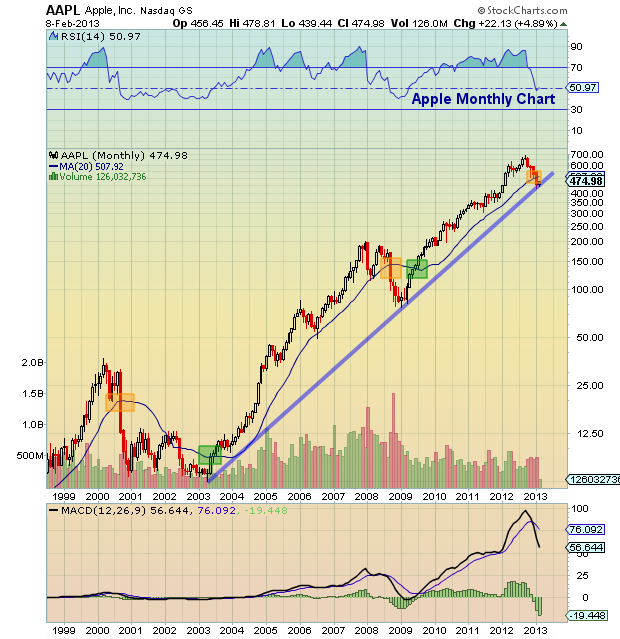
In December, I posted a long-term monthly bar chart of Apple stock, highlighting the importance of the 20-month moving average. Over the past 15 years, sustained moves through this moving average have signaled trend changes. And there have only been 5 of them (2 to the upside, and 3 to the downside). With this in mind, Apple’s stock is still on its heels (despite the recent 9% rally off the lows). And this condition will continue until the stock price decisively breaks above this key AAPL technical resistance level (currently at $507.92). I would be remiss if I didn’t note that the recent bounce began off the long-term uptrend support line. See chart below
AAPL Long-Term Monthly Bar Chart
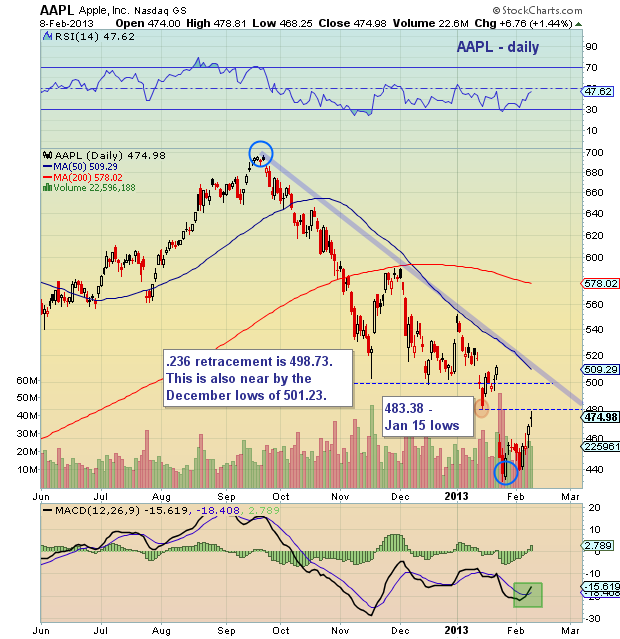
But there is more to this $500 dollar level than meets the eye, especially near-term. Looking at the daily chart below, AAPL has carved out a nice lower low bottoming formation and surged higher. As noted above, the $435 bottom is a 38.2% drop from the highs – a solid Fibonacci number (See “Anatomy of a Trader” series). In that vein, a 23.6% retrace of the September high to January low would be $498.73. We also have AAPL technical resistance in the form of the major downtrend line, 1st quarter earnings gap-fill, and the November and December lows. All of these resistance levels reside just above $500! This is quite a confluence of AAPL technical resistance, especially when adding the 20-month moving average to the mix. Taking variance into account, the resistance zone expands to $495-$510. But were not there yet…
A move above the January 15 lows ($483.38), would likely magnetize the stock price back to this key zone. On the downside, support resides in the $455-$460 area. A move below this support would be reason for more caution. See chart below
Trade safe, trade disciplined.
AAPL Near-Term Daily Bar Chart with AAPL technical resistance
Twitter: @andrewnyquist and @seeitmarket
No position in any of the mentioned securities at the time of publication.


