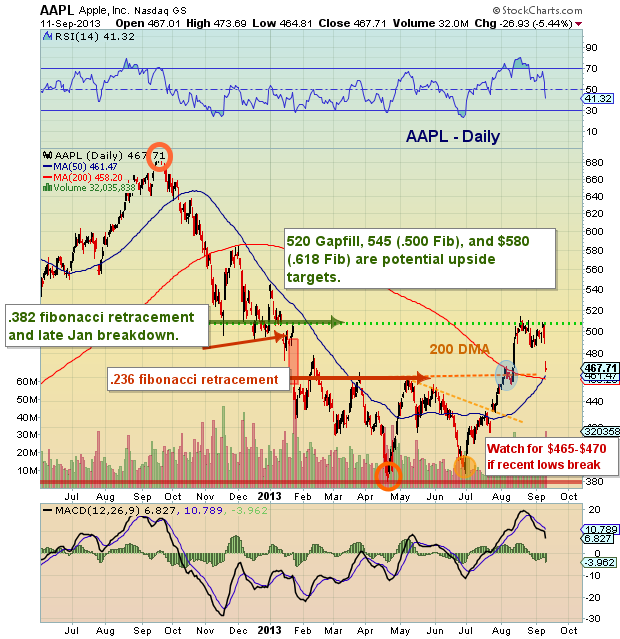
 Last week I posted an Apple (AAPL) stock chart highlighting the prospects for an AAPL measured move on my StockTwits stream. At the time, the possibility of an AAPL measured move was somewhat speculative, hinging upon the stock losing support at $485. However, I did notice that the .236 Fibonacci breakout level hadn’t been retested and there was a convergence of the 50/200 day moving averages occurring (which could use a retest as well). So this made sense… especially if $485 was lost.
Sure enough, when AAPL dropped at the open yesterday, it quickly found support just above the .236 Fibonacci breakout level and convergence area. Although Apple could rally a bit and test the upper bounds of the gap down (as high as 478-483), it is likely that Apple will put in another low, or at least retest yesterday’s lows. Any move below $460 that lasts more than a couple days would likely neutralize AAPL’s recent momentum. See chart below for reference. Again, this is a short-term analysis.
Check out our recent AAPL coverage.
Apple Stock Chart – AAPL Measured Move
Thanks for reading. Trade safe, trade disciplined.
Twitter: @andrewnyquist and @seeitmarket
No position in any of the mentioned securities at the time of publication. Any opinions expressed herein are solely those of the author, and do not in any way represent the views or opinions of any other person or entity.


