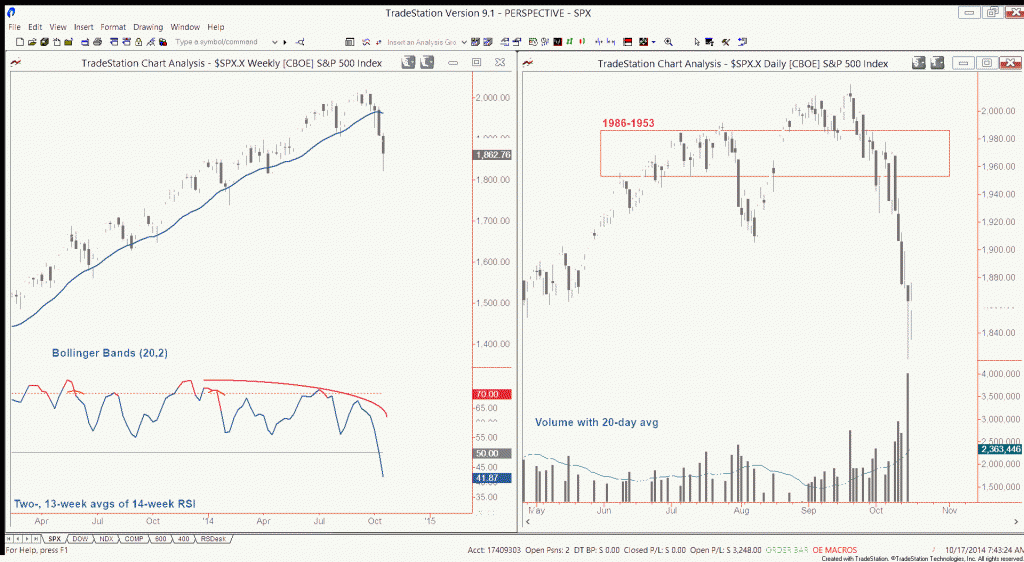
 In my last comment about the S&P 500, I argued that as long as a demand zone at 1986-1953 held the stock market would stay on course toward higher highs. That area of technical support failed and SPX sold off sharply; 1986-1953 now represents technical resistance. After the recent decline, it’s time to reassess.
On Wednesday SPX put in a substantial bullish hammer candlestick (small real body, longer lower shadow indicating strong buying into price weakness) accompanied by the heaviest volume since November 2011. These are the underpinnings of capitulation selling after the recent decline, especially since volume was pretty high in the preceding days as price fell. I expect to see a bounce here. See chart below – click to enlarge.
S&P 500 (SPX) Daily Chart
While it could be worth a swing trade on the long side of the market, it’s important to be aware that a technical break occurred which makes it a risky time to think about chasing the uptrend. One gauge I use to assess the health of the primary trend is the 20-week simple moving average. This average is poised to turn down this week for the first time since November 2012. Granted, a decline in the average isn’t an automatic signal that the primary trend is reversing down. Rather, focus on trading when the odds are in your favor. Until the 20-week average turns back up, the stock market will be at risk.
Another reason to stay cautious here is slowing momentum since late 2013. Note the lower highs in the fast and slow averages of the weekly relative strength index. Momentum can decline for some time before the market follows. What’s concerning now, however, is that the decline in the past month is a warning that the market is at risk of something bigger than a dip in an uptrend. With the 20-week average about to turn down and momentum deteriorating, the odds of success aren’t auspicious.
Net, if your time horizon is more than a few weeks, it’s a good time to step aside and observe rather than take on any new risk.
Follow Chris on Twitter: @ChrisBurbaCMT
No position in any of the mentioned securities at the time of publication. Any opinions expressed herein are solely those of the author, and do not in any way represent the views or opinions of any other person or entity.


