THE POWER OF THE MILLENNIALS
Markets ultimately price all assets based on the simple law of supply and demand.
Demographics play a large role on the demand side of the equation. From The Wall Street Journal:
The U.S. homeownership rate rose in 2017 for the first time in 13 years, driven by young buyers who overcame rising prices, tight supply and strict lending conditions to purchase their first homes.
This time, what’s driving the market is a shift in favor of owning rather than renting coming from the largest homebuying generation since the baby boomers: millennials.
“There’s no government incentive program in sight that is having this effect,” said Susan Wachter, a professor of real estate and finance at the Wharton School at the University of Pennsylvania. “This is back to basics.”
STOCKS, BABY BOOMERS, AND MILLENNIALS
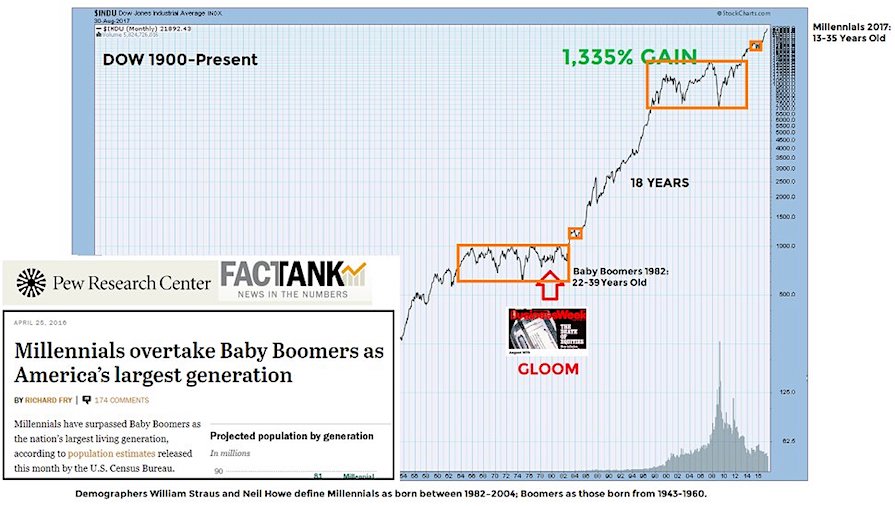
The baby boomers were 22-29 years old when a secular trend began in the stock market in 1982; the trend lasted 18 years. In 2017, the millennials were 13-35 years old. The demographics and chart patterns shown below tell us to keep an open mind about better than expected outcomes in the stock market over the next 5 to 20 years.
These concepts were covered in detail in a September 1, 2017 video. You can view this video again below Since publishing the video, stocks and housing have both appreciated.
September 1, 2017 Video – “Stocks: Demographic Boom or Bust?”
Thanks for watching and have a good week.
Twitter: @CiovaccoCapital
The author or his clients may hold positions in mentioned securities at the time of publication. Any opinions expressed herein are solely those of the author, and do not in any way represent the views or opinions of any other person or entity.


