For today, I am including a clip that covers currency pairs and several commodities.
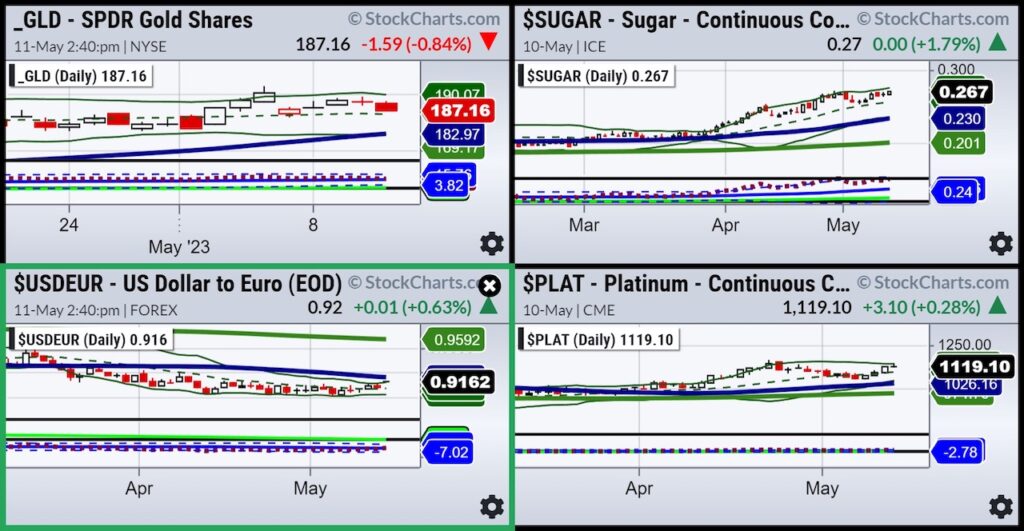
The four-chart screen is a daily screenshot of Gold (GLD), Sugar (continuous contract), the US dollar to the Euro (USDEUR) and Platinum continuous contract (PLAT).
The Gold ETF (GLD) is falling from its recent highs.
Sugar has run into some resistance with momentum currently in mean reversion to the downside.
The Dollar to the Euro shows the dollar strengthening while its momentum has a bullish divergence.
Platinum, mirroring gold, also looks like some resistance is at hand.

Have a listen to the clip as I go through the chart (futures) and give actionable information:
Stock Market ETFs Trading Analysis & Summary:
S&P 500 (SPY) 23-month MA 420
Russell 2000 (IWM) 170 support – 180 resistance
Dow (DIA) Now below the 23-month MA
Nasdaq (QQQ) 329 the 23-month MA
Regional banks (KRE) 42 now pivotal resistance-holding last Thurs low
Semiconductors (SMH) 23-month MA at 124
Transportation (IYT) 202-240 biggest range to watch
Biotechnology (IBB) 121-135 range to watch from monthly charts
Retail (XRT) 56-75 trading range to break one way or another
Twitter: @marketminute
The author may have a position in mentioned securities at the time of publication. Any opinions expressed herein are solely those of the author and do not represent the views or opinions of any other person or entity.


