The S&P 500 Index (INDEXSP: .INX) has experienced an uptick in volatility over the past few months.
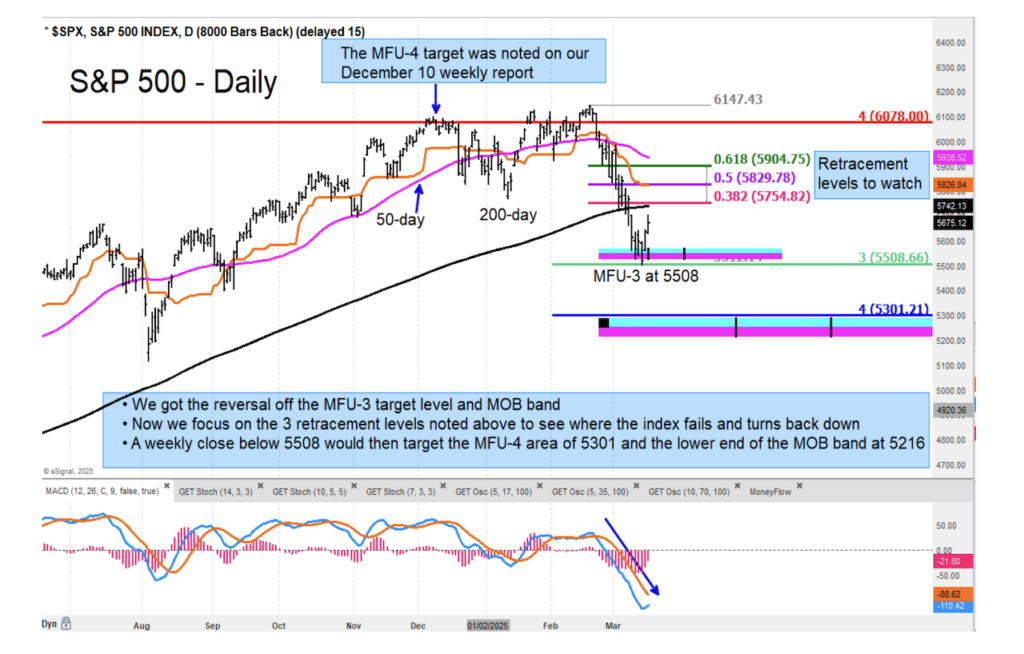
In December, the S&P 500 hit our MFU-4 target at 6078 and its been a bumpy ride ever since… the latest coming in the form of a 10 percent drop.
Several macro factors are tied to the technicals showing up on the chart.
Uncertain tariff policy has left American consumers in limbo after a strong Q4 spending performance.
Markets remain on edge, and every new hard-data clue on spending trends is important.
Earnings from Lululemon and Disney’s annual shareholder meeting may offer fresh insights into the health of household finances.
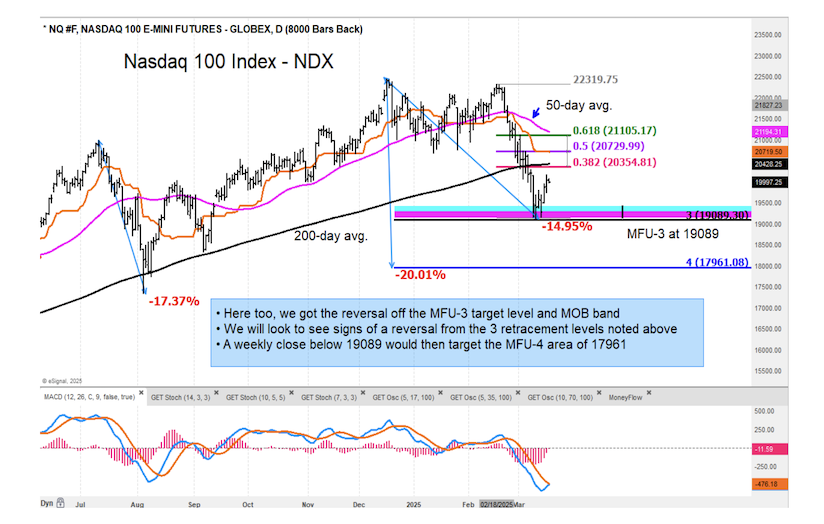
Below are updated charts of the S&P 500 Index and Nasdaq 100 Index.
Check out my research offerings on Cerundolo Investment Research.
Twitter: @GuyCerundolo
The author or his firm have a position in mentioned securities at the time of publication. Any opinions expressed herein are solely those of the author, and do not in any way represent the views or opinions of any other person or entity.
 Traders Have Not Missed the Boat")
: Two Important Price Levels To Watch")


