I always like to look through the core 6 ETFs that we follow to gauge the stock market. This helps to better understand the broader market and S&P 500 (NYSEARCA: SPY).
With the rally to end the week we are looking for signs that:
- The market bottomed or rallied to resistance
- The best and worst performing areas
- The follow-through that’s needed.
First, a reminder on daily chart formations…
What constitutes a bottom? Technically:
Blow off price action to the downside with huge volume, followed by a green day with big volume.
- A new low followed by a close the next day over the previous day high.
- After the new low day, it could be an inside trading day the following day that closes green, then followed by an up day the 3rd day where price closes higher than the high of the day price made a new low.
- Phase change-a move and confirm over a major moving average (50 and/or 200 DMA).
Given the new low for the S&P 500 ETF (SPY) on Thursday and then the price action on Friday, it does look good.
However, if you look back to the Daily, the 200-DMA looms large overhead.
SPY has more work to do to also change phase like it did in 2023.
NASDAQ is not as pretty and is also well below its 50-WMA.
Both SPY and QQQ must get back over and close above their 50-WMA to convince bulls the move Friday, while a reversal in the works, is not just a dead cat bounce.
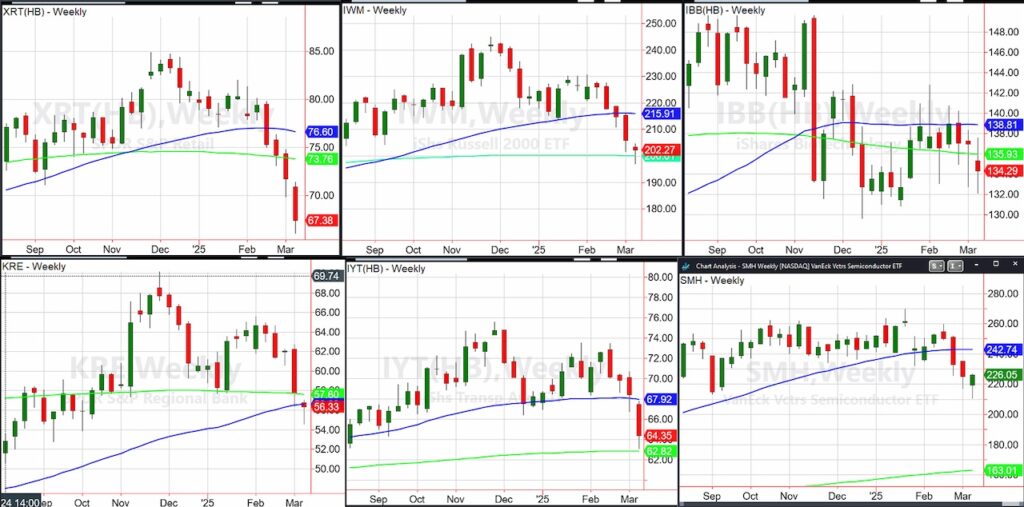
As far as our core family of ETFs, the weekly charts show the Retail Sector (XRT) sector still a major concern.
While we have seen growth leading the market for years (and then again on Friday), with tariffs and inflation fears, it’s Retail we need to watch to assess what happens next in the economy.
Russell 2000 (NYSEARCA: IWM) has held the 200-week moving average making the $200 price level really important.
The Biotech Sector (IBB) has established a range going back to November 2024 between 130-140. There is little point in trading this ETF until we see what the range does.
Regional Banks (KRE) managed to hold very close to the 50-WMA, which makes this a decent candidate for a run-up in financials should it get a strong start this week.
The Transportation Sector (IYT), like IWM, held the 200-WMA to date. Dow theory in play, with XRT weak, IYT is necessary to convince investors this potential bottom has legs.
Semiconductors, well under the 50-WMA, yet well above the 200-WMA, makes this sector close with regional banks in strength.
For more reference on longer timeframes, here are the monthly charts.
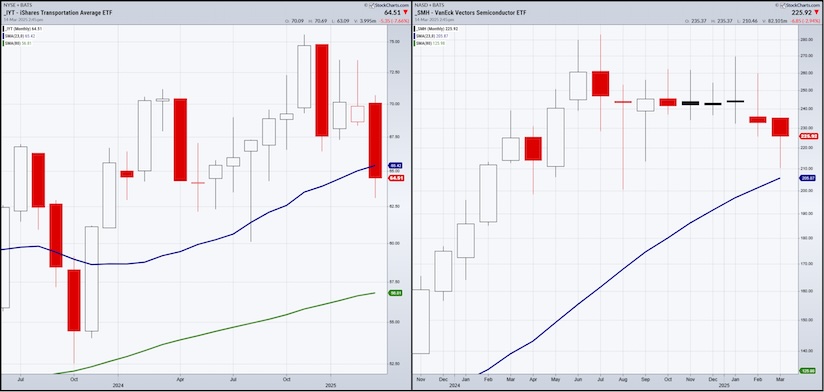
On the monthly chart I use a 23-month (blue) and an 80-month (green) moving average.
The 23-month represents a 2-year business cycle while the 80 month is 6-year business cycle.
The 2-year business cycle can change from contraction to expansion. However, the 6-year business cycle represents a sea change.
Retail (XRT) is in a 2-year business cycle contraction while the longer business cycle is fine.
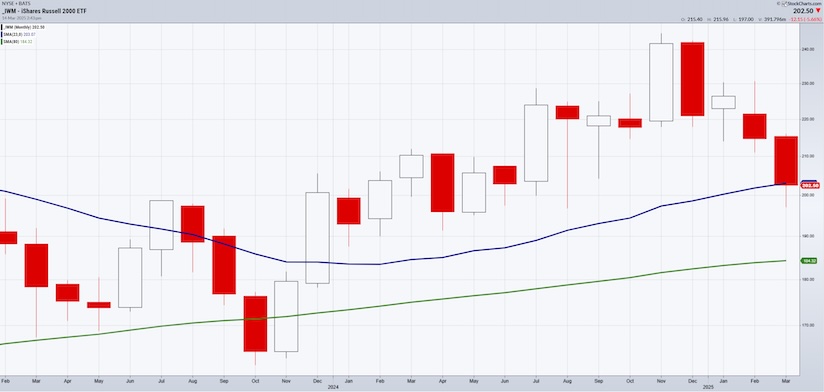
The Russell 2000 (IWM) is on the precipice of a contraction or, possibly, a great buy opportunity for renewed expansion. This is why that $200 level in IWM is key.

Transportation (IYT) now shows contraction should the price remain below the 23-month MA.
Sister Semiconductors SMH, on a business cycle comparison, is still fine.
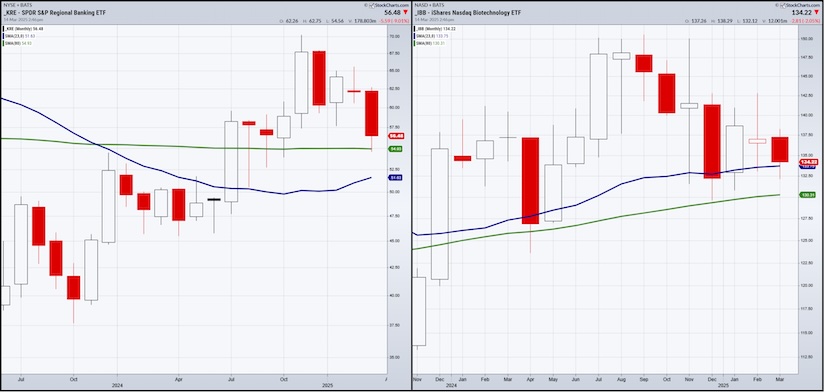
Regional Banks KRE has inverted moving averages meaning the 80-month is above the 23-month. I interpret this as, should KRE and the market hold up, we could see the 23-month cross back over the 80-month, which would be healthy.
Biotech IBB, while trading in a $10 range, does continue to hold the 23-month. Hence, this is not in contraction or expansion, just stuck in a range.
Summary
- SPY and QQQ show no signs of recession and might have bottomed out needing a bit more follow-through
- IWM if holds above the 200-WMA and the 23-month MA, could be a low-risk investment. If fails, it would hard to remain bullish.
- XRT is the trouble spot-watch this carefully. With an inside day Friday, this fits the formula for a bottom ONLY if XRT clears and closes above 68.40 Monday. The same is true with IYT.
- SMH, like QQQ and SPY, shows no sign of recession, but needs to keep going.
- Fins KRE can move, and Biotech is on the fence.
Twitter: @marketminute
The author may have a position in mentioned securities at the time of publication. Any opinions expressed herein are solely those of the author and do not represent the views or opinions of any other person or entity.
: Creating Bullish Divergence?")


 and Semiconductors (SMH): Concerning Price Pattern?")


