Markets pulled back, and sentiment went very negative already (which is good). This looks like a standard reset within an ongoing bull market rather than the start of something different.
Remember going back to 1948, markets fall 5% on average 3 times a year and fall 10% once a year. Volatility is normal and allows for us to be opportunistic here.
My firm sold Planet Fitness a month ago at its recent highs, held cash, along with selling Nutanix here as it was hitting its highest level in 8 years. So selling assets that have worked for us to add four new companies. I will have more on these companies next week.
Overall, how the market is acting, structurally, this setup looks a lot like 2024-where fear created some really good opportunities of the year. We are doing just that.
THE DATA.
- AAll Bearish Sentiment >60% → Historically followed by strong forward returns.
- $7T in Money Markets → Ample liquidity remains for potential equity inflows.
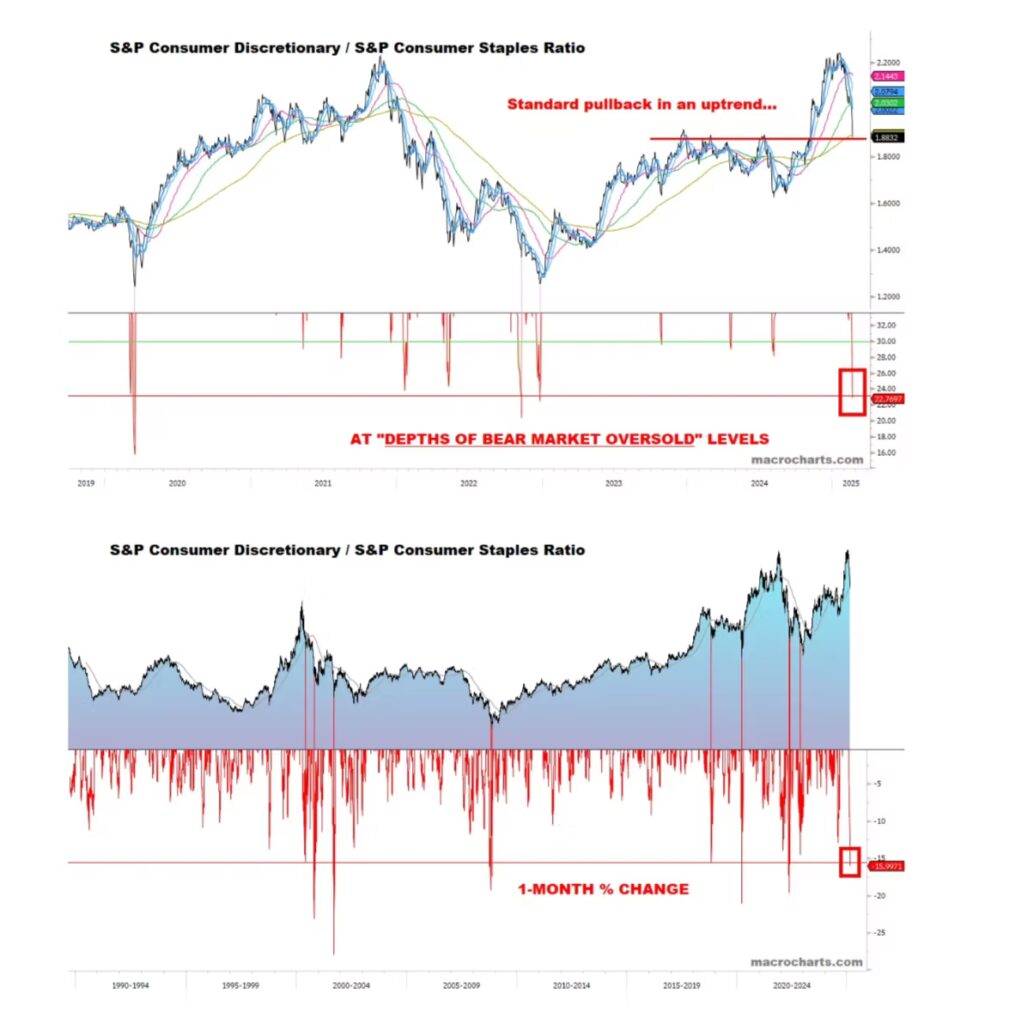
- Consumer Discretionary vs. Staples Ratio at “Bear Market Oversold” Levels → Investors are hiding in Staples, but fundamentals don’t support it.
Data Point #1: AAII Bearish Sentiment >60% = Good!
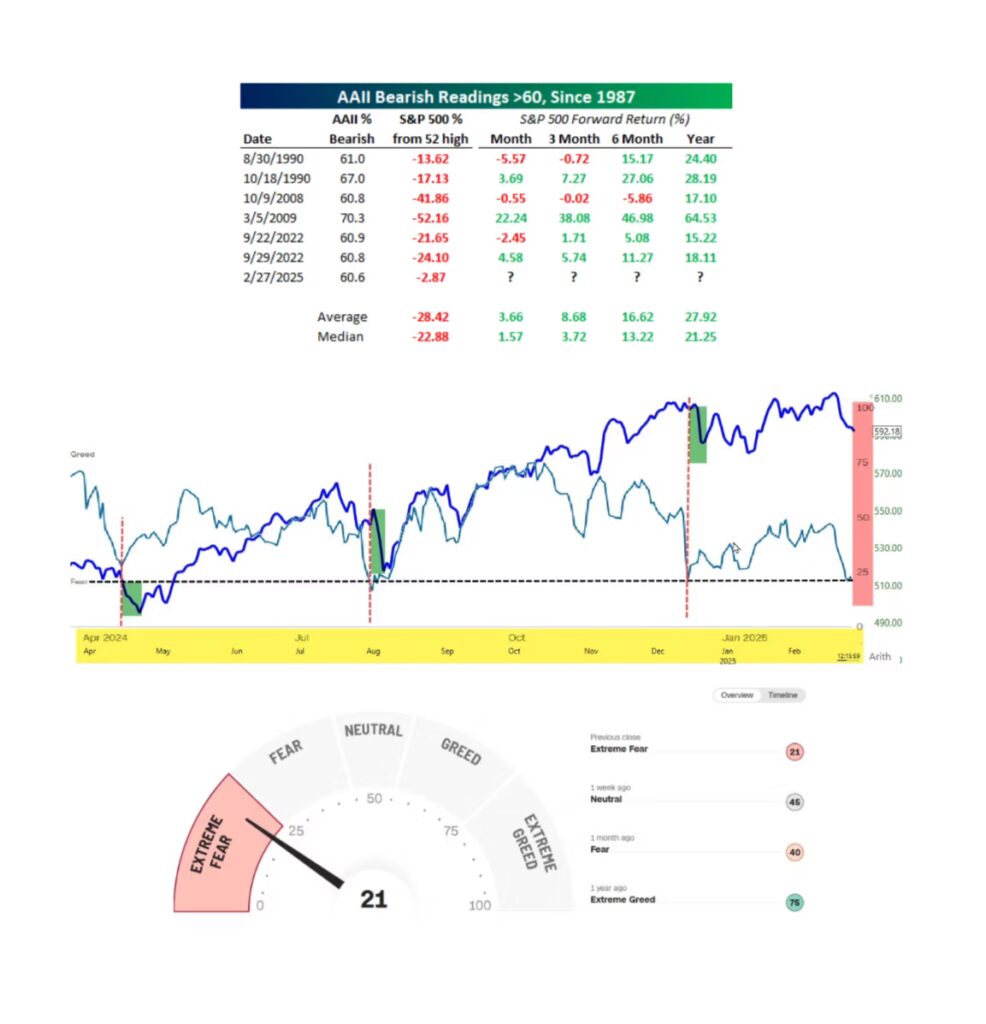
What’s Happening?
The AAII Sentiment Survey shows bearish sentiment at 60.6%, a rare level historically.
The last time we saw this was September 2022—stocks surged after.
Past occurrences have preceded strong forward returns over 3, 6, and 12 months.
Fear is at extremes—previous spikes coincided with major buying opportunities.
Average 12-month return after >60% bearish readings → +27.9%.
Investor Takeaway
Historically, extreme bearish sentiment has been a contrarian indicator. This data suggests investors are overly fearful, which often creates opportunity.
Data Point #2: $7 Trillion in Money Markets
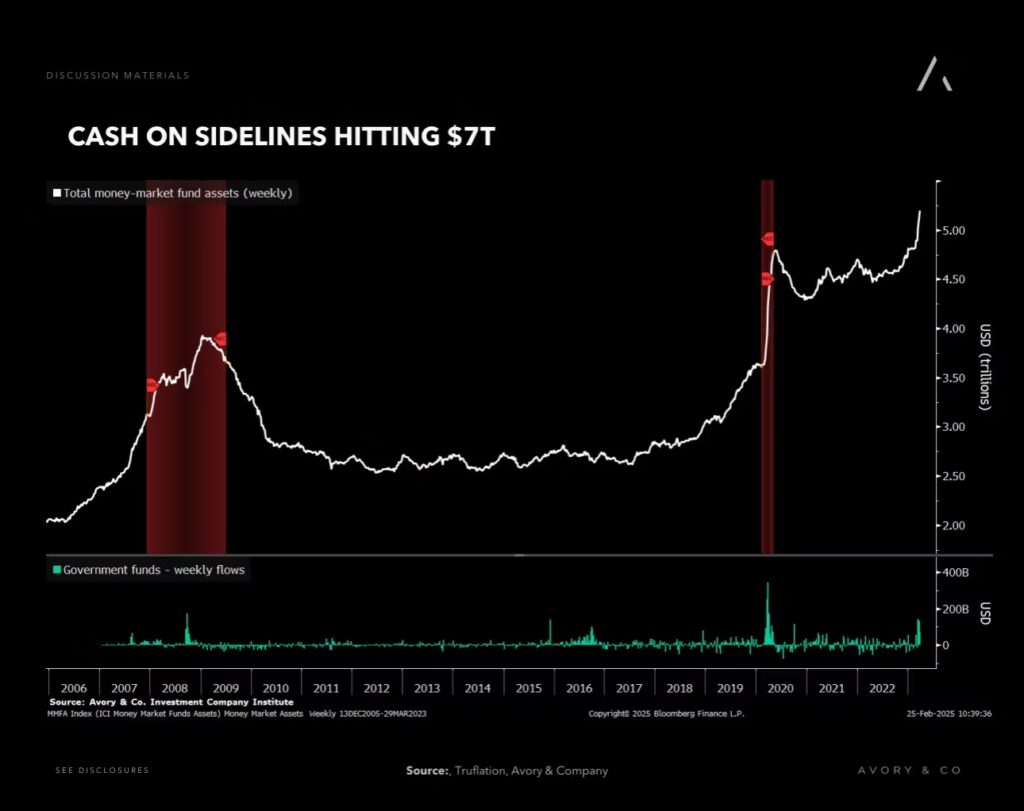
Cash in money market funds remains near record highs—at $7 trillion.
- Investors haven’t redeployed cash into risk assets, despite equity strength.
- Historically, when cash levels are this high, it fuels equity ralliesas investors shift back into stocks.
- Rate cuts ahead? The Fed could still ease policy later in 2025, supporting risk-on flows.
- Cash sitting idle is dry powder—historically, major stock rallies begin when liquidity is high.
Investor Takeaway
This remains one of the biggest sources of potential upside for markets. Once investors start reallocating, markets could get another strong leg higher.
Data Point #3: Consumer Discretionary vs. Staples Rotation—Driven by Economic Fear
What’s Happening?
The S&P Consumer Discretionary vs. Staples ratio has dropped to levels typically seen in bear markets, but this is happening within a bull market.
- Investors are hiding in Staples—but economic data doesn’t justify it.
- The last time this ratio hit these levels? The market bottomed and discretionary outperformed.
- Corporate earnings suggest businesses are healthy, making this a potential mis-pricing.
Investor Takeaway
This looks fear-driven, not fundamentally justified.
- The economy is in a solid position—employment remains healthy enough, consumer spending is holding up, and corporations just finished an earnings season that showed stable margins and revenue growth.
- Historically, discretionary vs. staples rotations like this tend to reverse when the economic outlook stabilizes.
Twitter: @_SeanDavid
The author and/or his firm have positions in the mentioned companies and underlying securities at the time of publication. Any opinions expressed herein are solely those of the author, and do not in any way represent the views or opinions of any other person or entity.
 Is Telling Broader Stock Market?")


 Nearing A Bottom?")

