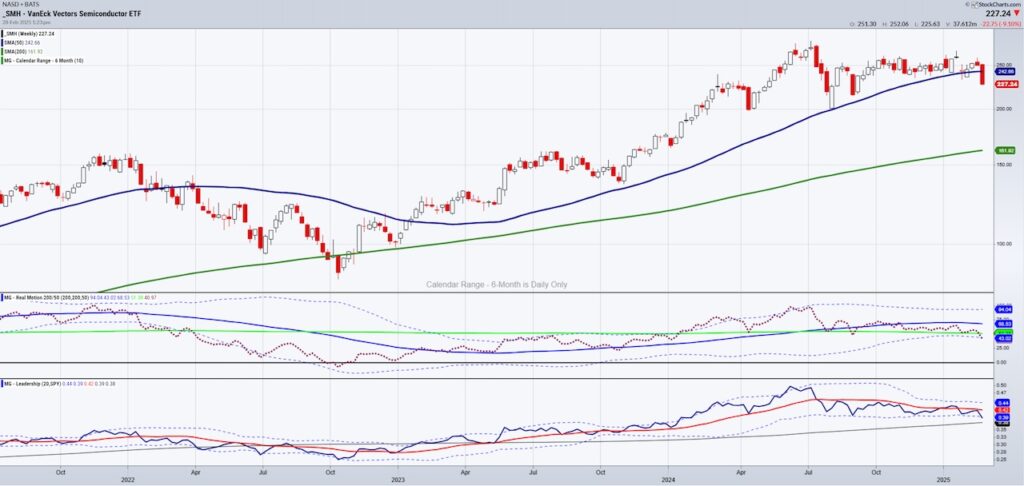
It has been 2 years and 2 months since the ETF for Semiconductors SMH has traded below the 50-week moving average.
The momentum, as seen through the lens of Real Motion, continues to sit in a bearish divergence to price. The red dots are below the 200-WMA while price remains well above.
The Leadership flipped to favor the S&P 500 last July. To date, that remains the case.
So why are analysts once again telling folks to buy the dip?
Why do so many see this as a buyable dip?
And why is it so urgent in a sea of uncertainty to buy anything in this sector right now?
Here is where price should dictate the narrative.
Looking at the rest of the Economic Modern Family…
Earlier last week, I wrote about the consumer sector flashing a warning.
Granny Retail XRT (as she is called) not only broke down under the 50-week moving average, but also the 200-WMA.
This is a distribution phase which means cash is leaving the consumer sector.
Granddad Russell 2000 IWM also broke down from the 50-WMA.
While doing a bit better than the consumer, through the years of tracking the Family, when one major member throws in the towel, eventually we could see spillover everywhere.
Naturally Biotechnology IBB fell with the overall market. However, a move back over the 200-WMA could present as an opportunity in that sector.
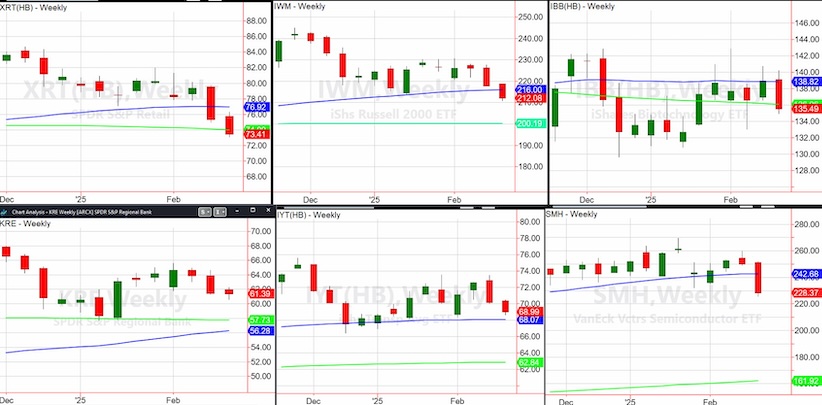
Interestingly though, Transportation IYT is holding up.
Regional Banks KRE are also outperforming.
This is encouraging in that we can see that financials and transportation could be telling us that the consumer is nervous, but the economy may not go the way of recession anytime soon.
Last week, I also noted the anomaly of junk bonds, while underperforming the long bonds, were still looking quite bullish, a good sign.
Meanwhile, Semiconductors have been a growth sector for over a decade.
But with talk of tariffs that could also be resolved, it is possible that this painful move lower across the board, is temporary.
Maybe it will be the Fed pivot in March (as I have predicted since December 2024) that helps.
We imagine the consumer would sigh relief if interest rates were lowered.
That could in turn, goose inflation. But one wall of worry at a time.
Regardless, let’s let price dictate that narrative.
This is the monthly chart of Retail XRT.
Zooming out is a great way to gain an even better perspective.
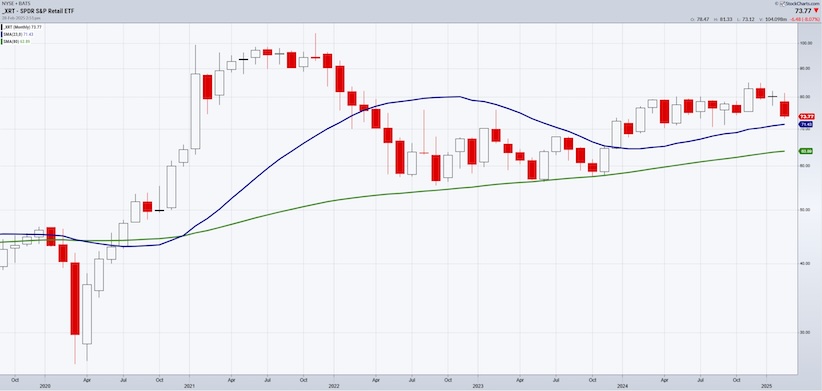
The blue line is the 23-month moving average, and the green line is the 80-month moving average.
I made a big deal when XRT held the 80-month MA throughout 2022 and 2023 when the going looked bleak.
I made a big deal when XRT cleared the 23-mont MA in December 2023, as it went from teetering on recession, to entering a 2-year business cycle expansion.
And now, I am making a big deal that XRT remains above that key 23-month moving average.
So, while the weekly chart looks iffy, the evidence of the other Modern Family sectors holding, the junk bonds holding, the monthly charts still intact and, the green close on Friday, I am still not preaching doom and gloom.
Twitter: @marketminute
The author may have a position in mentioned securities at the time of publication. Any opinions expressed herein are solely those of the author and do not represent the views or opinions of any other person or entity.

 Weakness Remains; Sell Rallies?")

 Is A Favorite AI Stock: What About Timing?")


