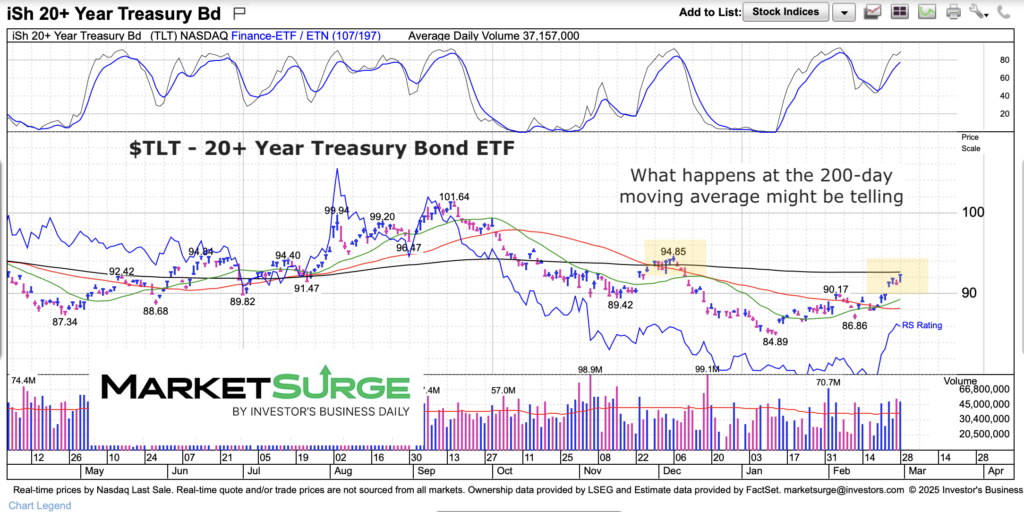
Treasury bond yields have turned lower over the past 6 weeks. And that means treasury bonds and the popular treasury bonds etf (TLT) have headed higher.
The last such rally attempt ended with TLT after a test of its 200-day moving average.
And that’s about where this rally is right now.
This is worth watching from an trading/investing perspective (to see if lower interest rates are a real thing) and if bonds are headed higher, as well as an economic perspective (do lower interest rates mean a slowing economy?).
As usual, I share a simple chart that does the writing for me.
Note that the following MarketSurge charts are built with Investors Business Daily’s product suite.
I am an Investors Business Daily (IBD) partner and promote the use of their products. The entire platform offers a good mix of tools, education, and technical and fundamental data.
$TLT 20+ Year Treasury Bonds ETF Chart
Relative strength has recovered nicely, though slightly overbought. Might be time for 7-10 days of consolidation. Worth watching here for many reasons.
Twitter: @andrewnyquist
The author may have a position in mentioned securities at the time of publication. Any opinions expressed herein are solely those of the author, and do not in any way represent the views or opinions of any other person or entity.

 Having Its Day: What’s Next?")

 Weakness Remains; Sell Rallies?")

 Fails Key Support Level; What’s Next?")
