Gold prices continue to move swiftly higher as gold nears $3000/ounce.
Feels like a big rally already. But gold may be in the early innings of a longer-term run… especially if today’s chart pattern proves to be as bullish as it looks.
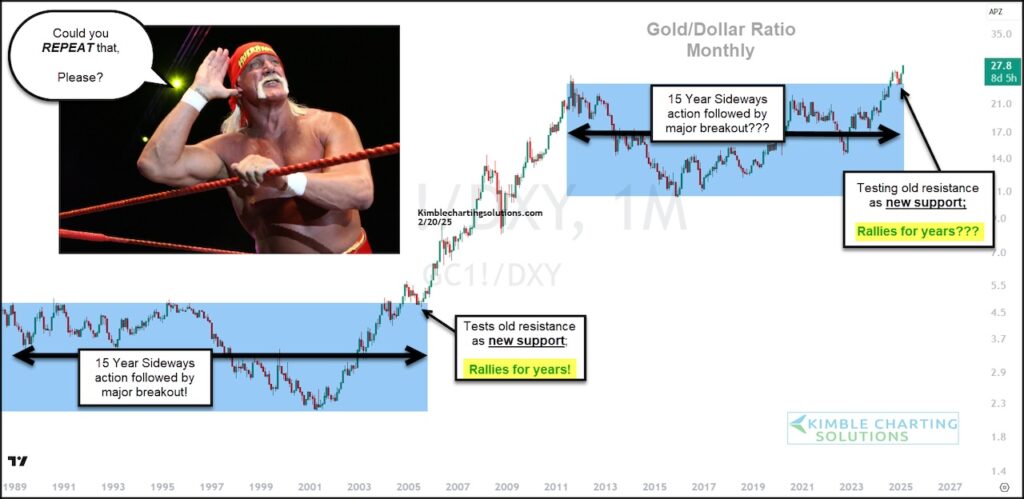
Below is a long-term “monthly” chart of the ratio of Gold to the U.S. Dollar.
Is Gold/Dollar repeating the pattern of its past?
Notice that the ratio traded sideways for 15 years before posting a historical break out in the early 2000’s… and rallying for years.
Then gold repeated that 15 year sideways trading pattern before attempting to break out again more recently. History in the making?
Notice as well that both breakouts first tested old resistance as new support followed by breakout confirmation!?!?
Will the gold / U.S. Dollar ratio rally for years again? Stay tuned!
Gold / U.S. Dollar Ratio “monthly” Price Chart

Twitter: @KimbleCharting
The author may have a position in mentioned securities. Any opinions expressed herein are solely those of the author, and do not in any way represent the views or opinions of any other person or entity.


