Muhammad Ali was speaking at a Harvard commencement ceremony in 1975 when a student shouted, “Give us a poem, Muhammad!”
Ali paused and then said, “Me, We.”
Thank you, Ali, as I have been using that poem only in reverse-from we to me-to describe the consumer of 2025.
My “we to me” is meant to describe a changing landscape of consumers.
During COVID the spending on “we” began.
After COVID, we started to see more spending on “me.”
Now, with the diet drugs we see certain areas of “me” spending picking up, but we also see some issues with certain companies one would think should perform well.
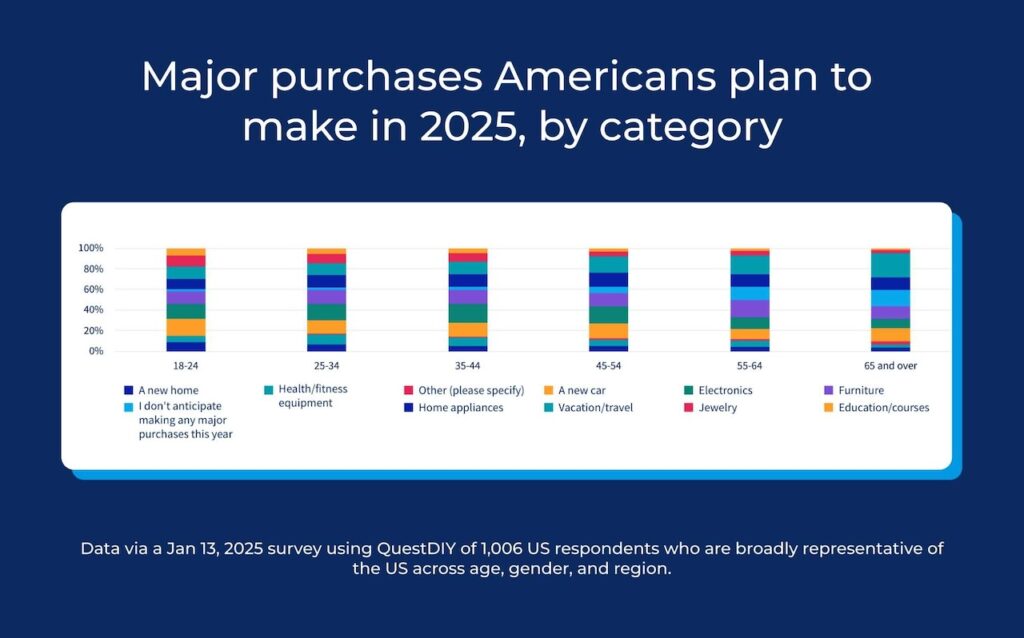
The survey on Major Purchases Americans Plan to Make in 2025 is an “AI-powered platform to survey a representative sample of 1,006 Americans, gleaning actionable info about which demographic cohorts would be most fruitful to brands in the travel or vacation space.” Stagwell Marketing Cloud
The survey fits well into the vanity or “we to me” trade as 72% said they were planning a vacation and of that 36% said it would be a beach vacation.
Showing off that thinner bod?
Note that electronics are another hot space for spending. A different type of me consumer.
Third is health and fitness, which totally supports the vanity trade.
However, this survey is quite specific.
What we need to know is how the consumer at large is going to do this year.
While many are spending enthusiastically, there is also a movement called the “No Buy” challenge.
2025 is shaping up to be the year of underconsumption or “no buy” trends.
Fear and fatigue about inflation, consumerism, and threats of tariff-related price hikes circulate.
Hence, without the Retail sector (XRT), trouble lies ahead.
Happily, we have a way to look at how price will dictate the consumer narrative through her.
Currently though, the best we can say is we don’t know enough yet.
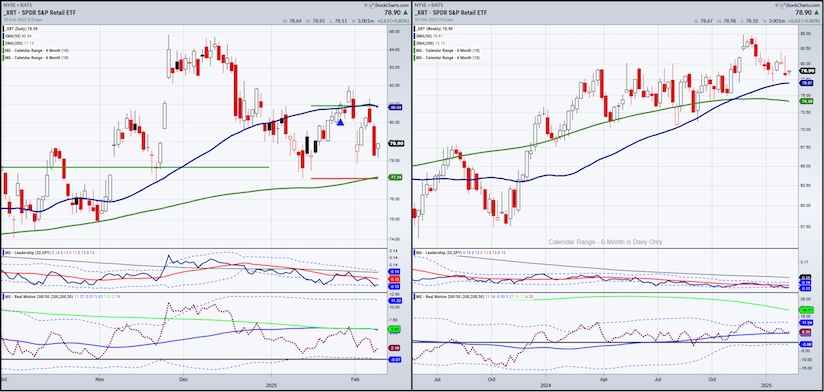
What do the Daily and Weekly charts of XRT tell us?
On the Daily chart, the price is right in the middle between the January 6-month calendar range low and high.
Undecided.
Most fascinating is that the high corresponds with the 50 daily moving average while the low corresponds with the 200 daily moving average.
Honestly, that is about as clean as a chart can get. While XRT flounders in the middle, there is not much to conclude.
Granny XRT is underperforming-that’s not great.
The momentum is starting to indicate a bearish divergence-also not so great.
On the weekly chart, XRT has held the 50-WMA since October 2023.
That would be most likely a significant start to a much bigger selloff should XRT break that weekly moving average.
While the indicators lean neutral to bearish, we know that can change in a volatile market.
What we also know is that there is no reason to do what the retail traders are doing—accumulating stocks like there’s not tomorrow
NOT UNTIL the price charts tell us to do so.
Twitter: @marketminute
The author may have a position in mentioned securities at the time of publication. Any opinions expressed herein are solely those of the author and do not represent the views or opinions of any other person or entity.
, Then Biotechnology (IBB)")
: Will Price Dictate Current Narrative?")

: Will Price Dictate Current Narrative?")
: A Top 2025 Stock Pick and New Opportunity")

, Then Biotechnology (IBB)")