It’s been a crazy bullish start to the year for precious metals stocks… and this, in turn, has carried over to materials stocks.
The Materials Sector ETF (XLB) rallied higher over the first two weeks of the year.
However, XLB has been consolidating for the past few weeks. This is typically bullish, but technical investors are at a crossroads because the rally is out of a multi-month low formed in January.
So the question is whether this is a bounce or the start of a new rally higher?
Note that the following MarketSurge charts are built with Investors Business Daily’s product suite.
I am an Investors Business Daily (IBD) partner and promote the use of their products. The entire platform offers a good mix of tools, education, and technical and fundamental data.
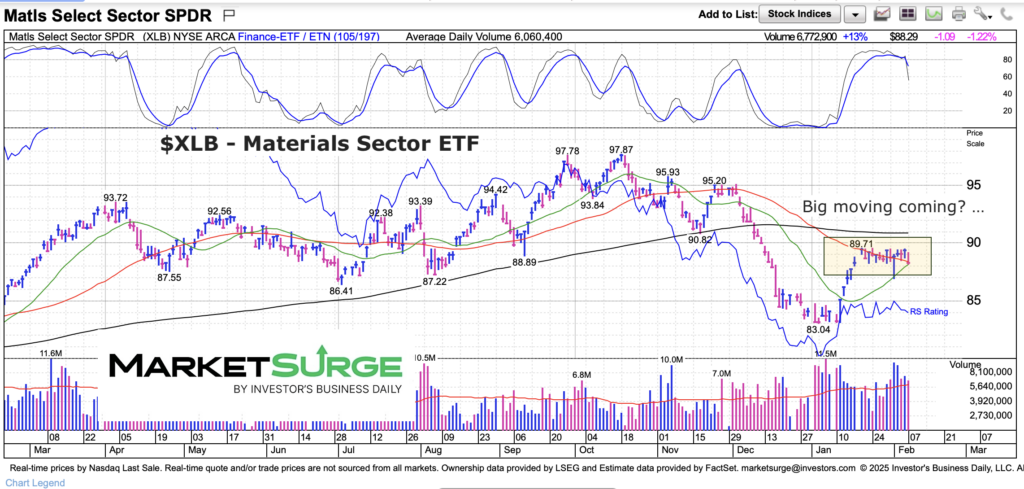
$XLB Materials Sector Chart
Price is holding above the 20 and 50 day moving averages. Active investors do not want to see price close below this level for more than 2 days (needs to quickly recover). A pullback in momentum means that we could see volatility over the coming week. Stay tuned!
Twitter: @andrewnyquist
The author may have a position in mentioned securities at the time of publication. Any opinions expressed herein are solely those of the author, and do not in any way represent the views or opinions of any other person or entity.


