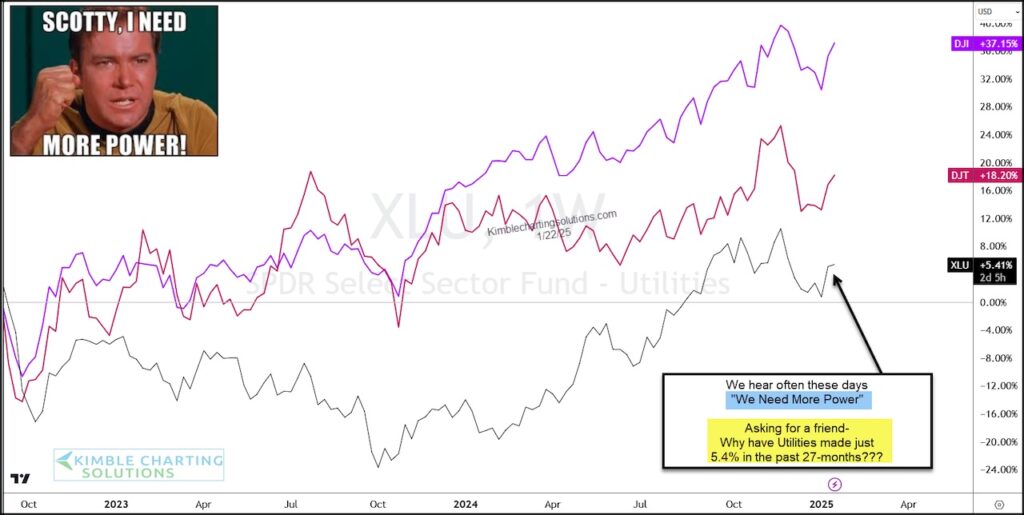
Today we provide a quick update on three key components to Dow Theory, looking at the performance of the Dow Jones Industrial Average, Dow Jones Transportation Average and the Utilities Sector ETF (XLU).
More specifically, we look at performance over the past 27-months.
As you can see in the chart below, Utilities (XLU) have been a major laggard. Seems like we hear we need more power nearly every day…
If this is the case, then why has XLU made just 5% in 27-months – asking for a friend.
Meanwhile, all 3 indices pulled back to begin the year and have yet to make a new high. This will be something to watch in the weeks ahead. As well as the lagging Utilities. Stay tuned!
Dow Jones Industrials vs Transports vs Utilities Price Chart

Twitter: @KimbleCharting
The author may have a position in mentioned securities. Any opinions expressed herein are solely those of the author, and do not in any way represent the views or opinions of any other person or entity.


