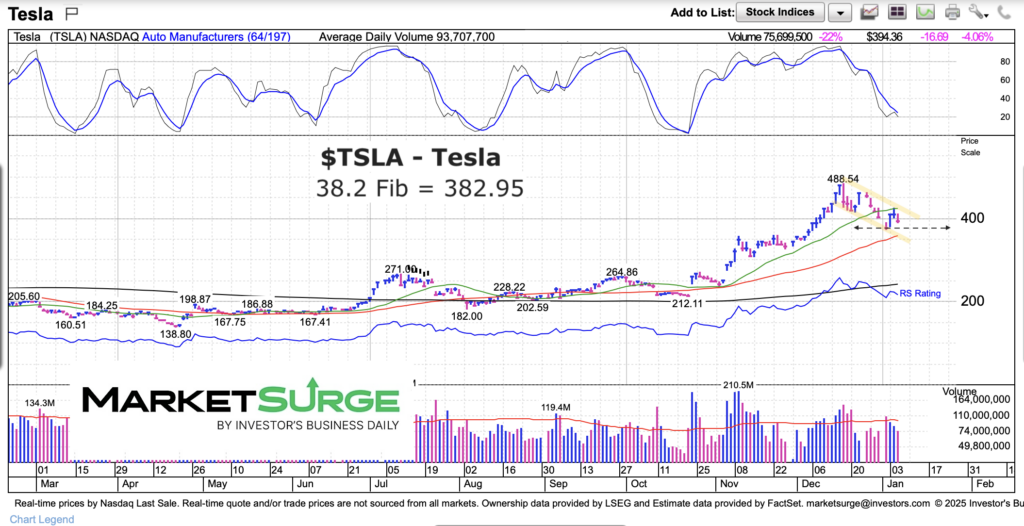
Tesla (NASDAQ:TSLA) investors had plenty to cheer about in the weeks following the presidential election seeing Tesla’s stock price double.
Like many sharp rallies, it ended up being too far, too fast.
Tesla is now in a multi-week pullback with profit taking a big part of the selloff (thus far).
While the selloff has been measured (thus far), it is important to be aware of key TSLA price support areas that investors would like to see hold. Today we highlight two of these guideposts in the chart below.
Note that the following MarketSurge charts are built with Investors Business Daily’s product suite.
I am an Investors Business Daily (IBD) partner and promote the use of their products. The entire platform offers a good mix of tools, education, and technical and fundamental data.
$TSLA Tesla Stock Price Chart
As you can see, the pullback has remained within a falling consolidation channel. The first important price support is the 38.2 Fibonacci retracement level around $382. The second support is nearby at the 50-day moving average. Bulls want to see price firm up around these levels.

Twitter: @andrewnyquist
The author may have a position in mentioned securities at the time of publication. Any opinions expressed herein are solely those of the author, and do not in any way represent the views or opinions of any other person or entity.


